- Table View
- List View
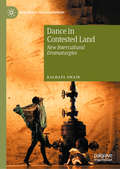
Dance in Contested Land: New Intercultural Dramaturgies (New World Choreographies)
by Rachael SwainThis book traces an engagement between intercultural dance company Marrugeku and unceded lands of the Yawuru, Bunuba, and Nyikina in the north west of Australia. In the face of colonial legacies and extractive capitalism, it examines how Indigenous ontologies bring ecological thought to dance through an entangled web of attachments to people, species, geologies, political histories, and land. Following choreographic interactions across the multiple subject positions of Indigenous, settler, and European artists between 2012–2016 the book closely examines projects such as Yawuru/Bardi dancer and choreographer Dalisa Pigram’s solo Gudirr Gudirr (2013) and the multimedia work Cut the Sky (2015). Dance in Contested Land reveals how emergent intercultural dramaturgies can mediate dance and land to revision and reorientate kinetics, emotion, and responsibilities through sites of Indigenous resurgence and experimentation.
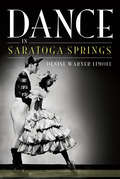
Dance in Saratoga Springs
by Denise Warner LimoliKnown to aspiring dancers and ballet enthusiasts worldwide, Saratoga Springs is much more than the home of the National Museum of Dance. The arts have always been nurtured in the Spa City, and in 1964, the world-famous founder of the New York City Ballet, George Balanchine, decided to make the new Saratoga Performing Arts Center his company's summer home. The company has brought some of the world's most famous dancers and choreographers to Saratoga ever since. Skidmore College offered one of the best dance programs in the nation, and several prestigious academies and summer programs have made Saratoga their home, helping young people from Lake Avenue and around the world achieve that illustrious dream of dancing professionally. Skidmore dance professor Denise Warner Limoli narrates this beautiful history, from turn-of-the-century "floral fetes" to today's vibrant dance community.
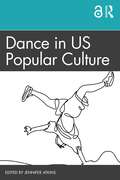
Dance in US Popular Culture
by Jennifer AtkinsThis innovative textbook applies basic dance history and theory to contemporary popular culture examples in order to examine our own ways of moving in—and through—culture. By drawing on material relevant to students, Dance in US Popular Culture successfully introduces students to critical thinking around the most personal of terrain: our bodies and our identities. The book asks readers to think about: what embodied knowledge we carry with us and how we can understand history and society through that lens what stereotypes and accompanying expectations are embedded in performance, related to gender and/or race, for instance how such expectations are reinforced, negotiated, challenged, embraced, or rescripted by performers and audiences how readers articulate their own sense of complex identity within the constantly shifting landscape of popular culture, how this shapes an active sense of their everyday lives, and how this can act as a springboard towards dismantling systems of oppression Through readings, questions, movement analyses, and assignment prompts that take students from computer to nightclub and beyond, Dance in US Popular Culture readers develop their own cultural sense of dance and the moving body’s sociopolitical importance while also determining how dance is fundamentally applicable to their own identity. This is the ideal textbook for high school and undergraduate students of dance and dance studies in BA and BfA courses, as well as those studying popular culture from interdisciplinary perspectives including cultural studies, media studies, communication studies, theater and performance studies.
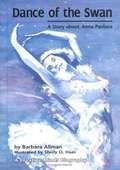
Dance of the Swan: A Story about Anna Pavlova
by Barbara AllmanA biographical account of the life of Anna Pavlova, the famous ballerina.
Dance on the American Musical Theatre Stage: A History
by Ray MillerDance on the American Musical Theatre Stage: A History chronicles the development of dance, with an emphasis on musicals and the Broadway stage, in the United States from its colonial beginnings to performances of the present day. This book explores the fascinating tug-and-pull between the European classical, folk, and social dance imports and America’s indigenous dance forms as they met and collided on the popular musical theatre stage. This historical background influenced a specific musical theatre movement vocabulary and a unique choreographic approach that is recognizable today as Broadway-style dancing. Throughout the book, a cultural context is woven into the history to reveal how the competing values within American culture, and its attempts as a nation to define and redefine itself, played out through developments in dance on the musical theatre stage. This book is central to the conversation on how dance influences and reflects society, and will be of interest to students and scholars of Musical Theatre, Theatre Studies, Dance, and Cultural History.
Dance on the Historically Black College Campus: The Familiar and the Foreign (The Arts in Higher Education)
by Wanda K. EbrightThis volume explores the history of dance on the historically black college and university (HBCU) campus, casting a first light on the historical practices and current state of college dance program practice in HBCUs. The author addresses how HBCU dance programs developed their institutional visions and missions in a manner that offers students an experience of American higher education in dance, while honoring how the African diaspora persists in and through these experiences. Chapters illustrate how both Western and African diaspora dances have persisted, integrated through curriculum and practice, and present a model for culturally inclusive histories, traditions, and practices that reflect Western and African diasporas in ongoing dialogue and negotiation on the HBCU campus today.
Dance or Die: From Stateless Refugee to International Ballet Star A MEMOIR
by Ahmad JoudehA Syria-born dancer offers his deeply personal story of war, statelessness, and the pursuit of the art of dance in this inspirational memoir. DANCE OR DIE is an autobiographical coming-of-age account of Ahmad Joudeh, a young refugee who grows up in Damascus with dreams of becoming a dancer. When he is recruited by one of Syria&’s top dance companies, neither bombs nor family opposition can keep him from taking classes, practicing hard, and becoming a Middle Eastern celebrity on a Lebanese reality show. Despite death threats if Ahmad continues to dance, his father kicking him out of the house, and the war around him intensifying, he persists and even gets a tattoo on his neck right where the executioner's blade would fall that says, "Dance or Die." A powerful look at refugee life in Syria, DANCE OR DIE tells of the pursuit of personal expression in the most dangerous of circumstances and of the power of art to transcend war and suffering. It follows Ahmad from Damascus to Beirut to Amsterdam, where he finds a home with one of Europe's top ballet troupes, and from where he continues to fight for the human rights of refugees everywhere through his art, his activism, and his commitment to justice.
Dance to the Piper
by Joan Acocella Agnes De MilleBorn into a family of successful playwrights and producers, Agnes de Mille was determined to be an actress. Then one day she witnessed the Russian ballet dancer Anna Pavlova, and her life was altered forever. Hypnotized by Pavlova's beauty, in that moment de Mille dedicated herself to dance. Her memoir records with lighthearted humor and wisdom not only the difficulties she faced--the resistance of her parents, the sacrifices of her training--but also the frontier atmosphere of early Hollywood and New York and London during the Depression. "This is the story of an American dancer," writes de Mille, "a spoiled egocentric wealthy girl, who learned with difficulty to become a worker, to set and meet standards, to brace a Victorian sensibility to contemporary roughhousing, and who, with happy good fortune, participated by the side of great colleagues in a renaissance of the most ancient and magical of all the arts."
Dance's Duet with the Camera: Motion Pictures
by Telory D. D. Arendell Ruth BarnesDance's Duet with the Camera: Motion Pictures is a collection of essays written by various authors on the relationship between live dance and film. Chapters cover a range of topics that explore dance film, contemporary dance with film on stage, dance as an ideal medium to be captured by 3D images and videodance as kin to site-specific choreography. This book explores the ways in which early practitioners such as Loïe Fuller and Maya Deren began a conversation between media that has continued to evolve and yet still retains certain unanswered questions. Methodology for this conversation includes dance historical approaches as well as mechanical considerations. The camera is a partner, a disembodied portion of self that looks in order to reflect on, to mirror, or to presage movement. This conversation includes issues of sexuality, race, and mixed ability. Bodies and lenses share equal billing.
Dance, Access and Inclusion: Perspectives on Dance, Young People and Change
by Charlotte Svendler Nielsen Stephanie BurridgeThe arts have a crucial role in empowering young people with special needs through diverse dance initiatives. Inclusive pedagogy that integrates all students in rich, equitable and just dance programmes within education frameworks is occurring alongside enabling projects by community groups and in the professional dance world where many high-profile choreographers actively seek opportunities to work across diversity to inspire creativity. Access and inclusion is increasingly the essence of projects for disenfranchised and traumatised youth who find creative expression, freedom and hope through dance. This volume foregrounds dance for young people with special needs and presents best practice scenarios in schools, communities and the professional sphere. International perspectives come from Australia, Brazil, Cambodia, Canada, Denmark, Fiji, Finland, India, Indonesia, Jamaica, Japan, Malaysia, New Zealand, Norway, Papua New Guinea, Portugal, Singapore, South Africa, Spain, Taiwan, Timor Leste, the UK and the USA. Sections include: inclusive dance pedagogy equality, advocacy and policy changing practice for dance education community dance initiatives professional integrated collaborations

Dance, Dance, Dance (Fountas & Pinnell Classroom, Guided Reading)
by Cheryl BlockNIMAC-sourced textbook. Dazzling Dancers. Leap … kick … tap … twirl … WOW! Get ready to see some dazzling dancers.
Dance, Modernism, and Modernity
by Michael Huxley Ramsay BurtThis collection of new essays explores connections between dance, modernism, and modernity by examining the ways in which leading dancers have responded to modernity. Burt and Huxley examine dance examples from a period beginning just before the First World War and extending to the mid-1950s, ranging across not only mainland Europe and the United States but also Africa, the Caribbean, the Pacific Asian region, and the UK. They consider a wide range of artists, including Akarova, Gertrude Colby, Isadora Duncan, Katherine Dunham, Margaret H’Doubler, Hanya Holm, Michio Ito, Kurt Jooss, Wassily Kandinsky, Margaret Morris, Berto Pasuka, Uday Shankar, Antony Tudor, and Mary Wigman. The authors explore dancers’ responses to modernity in various ways, including within the contexts of natural dancing and transnationalism. This collection asks questions about how, in these places and times, dancing developed and responded to the experience of living in modern times, or even came out of an ambivalence about or as a reaction against it. Ideal for students and practitioners of dance and those interested in new modernist studies, Dance, Modernism, and Modernity considers the development of modernism in dance as an interdisciplinary and global phenomenon.
Dance, Modernity and Culture
by Helen ThomasFirst published in 1995. Routledge is an imprint of Taylor & Francis, an informa company.
Dance, Performance and Visual Art: Intersections with Material Culture
by Deborah Williams Linda E. Dankworth Henia RottenbergThis collection presents a selection of essays written from a point of view that has dance, movement, or performance at its centre, and examines the intellectual and material relationship to the art form from which they are conceived. The themes that emerge from the authors’ contributions signify a desire to explore individual techniques in making art or unravelling the techniques of others within the composition of visual art and its contemporary movement language. Similarly, textual, and pictorial representations depict both antiquated and modern art and all their social aspects of human life. Digitization also remains a strong focus in both dance and its representation in performance contexts and place in social constructs of societies.
Dance, Place, and Poetics: Site-specific Performance as a Portal to Knowing (Palgrave Studies in Movement across Education, the Arts and the Social Sciences)
by Celeste Nazeli SnowberThis book explores the relationship between the body, ecology, place, and site-specific performance. The book is situated within arts-based research, particularly within embodied inquiry and poetic inquiry. It explores a theoretical foundation for integration of these areas, primarily to share the lived experiences, poetry and dance which have come out of decades of sharing site-specific performances.
Dance, Professional Practice, and the Workplace: Challenges and Opportunities for Dance Professionals, Students, and Educators (Routledge Research in Education)
by Angela Pickard Doug RisnerOriginally published as a special issue of Research in Dance Education, now with an added chapter, this text acknowledges and celebrates the increasingly diverse careers and employment networks in which dance professionals and dance educators are engaged. Addressing issues and developments relating to the workplace of dance, the text explores what it means to transcend the boundary between dance as passion, and dance as employment. Chapters explore challenges of professional practice including limitations on access, precarity, bodily risk, gender inequality, and sexual harassment, and challenge the status quo to offer readers new ways of thinking about dance, and how this might translate into professional practice and work. Ultimately celebrating the passion which motivates dancers to embark on a professional career, and highlighting the elation and joy which such employment can bring, this volume encourages dance professionals, students, and educators to imagine things differently and develop teaching approaches, curricula, work places, and communities which capitalise on the diversity and dedication of individuals in the field. This text will be of great interest to graduate and postgraduate students, researchers, academics, professionals in the field of Dance, Dance Education, Choreography and related art forms, Curriculum studies and Sociology of Education.
Dance-Play and Drawing-Telling as Semiotic Tools for Young Children’s Learning (Routledge Research in Early Childhood Education)
by Susan Wright Jan DeansInvestigating children’s learning through dance and drawing-telling, Dance-Play and Drawing-Telling as Semiotic Tools for Young Children’s Learning provides a unique insight into how these activities can help children to critically reflect on their own learning. Promoting the concept of dance and drawing-telling as highly effective semiotic tools for meaning-making, the book enlivens thinking about the extraordinary capacities of young children, and argues for the incorporation of dance and drawing in mainstream early childhood curriculum. Throughout the book, numerous practice examples show how children use movement, sound, images, props and language to imaginatively re-conceptualize their everyday experiences into bodily-kinesthetic and spatial-temporal concepts. These examples illustrate children’s competence when given the opportunity to learn through dance and drawing-telling, as well as the important role that teachers play in scaffolding children’s learning. Based on award-winning research, this insightful and informative book makes a sought after contribution to the field of dance education and seeks to reaffirm dance as a powerful learning modality that supports young children’s expressive non-verbal communication. Encouraging the reader to consider the significance of multi-modal teaching and learning, it is essential reading for researchers in the dance, drawing and education spheres; postgraduate students taking courses in early childhood; play and dance therapists; and all early childhood teachers who have a specific interest in arts education.
Dancehall In/Securities: Perspectives on Caribbean Expressive Life (Routledge Advances in Theatre & Performance Studies)
by Patricia Noxolo ‘h’ Patten Sonjah N. Stanley NiaahThis book focuses on how in/security works in and through Jamaican dancehall, and on the insights that Jamaican dancehall offers for the global study of in/security. This collection draws together a multi-disciplinary range of key scholars in in/security and dancehall. Scholars from the University of the West Indies' Institute of Caribbean Studies and Reggae Studies Unit, as well as independent dancehall and dance practitioners from Kingston, and writers from the UK, US and continental Europe offer their differently situated perspectives on dancehall, its histories, spatial patterning, professional status and aesthetics. The study brings together critical security studies with dancehall studies and will be of great interest to students, scholars and practitioners in theatre, dance and performance studies, sociology, cultural geography, anthropology, postcolonial studies, diaspora studies, musicology and gender studies.
Dancers Among Us: A Celebration of Joy in the Everyday
by Jordan MatterThe mystery of the body in motion. The surprise of seeing what seems impossible. And the pure, joyful optimism of it all. Dancers Among Us presents one thrilling photograph after another of dancers leaping, spinning, lifting, kicking—but in the midst of daily life: on the beach, at a construction site, in a library, a restaurant, a park. With each image the reader feels buoyed up, eager to see the next bit of magic.Photographer Jordan Matter started his Dancers Among Us Project by asking a member of the Paul Taylor Dance Company to dance for him in a place where dance is unexpected. So, dressed in a commuter’s suit and tie, the dancer flew across a Times Square subway platform. And in that image Matter found what he’d been searching for: a way to express the feeling of being fully alive in the moment, unself-conscious, present.Organized around themes of work, play, love, exploration, dreaming, and more, Dancers Among Us celebrates life in a way that’s fresh, surprising, original, universal. There’s no photoshopping here, no trampolines, no gimmicks, no tricks. Just a photographer, his vision, and the serendipity of what happens when the shutter clicks.
Dancers of the Dawn (Dancers of the Dawn #1)
by Zulekhá A. AfzalDeep in the desert a storm is brewing. The first in a sweeping YA fantasy duology. 'Enchanting.' Katharine Corr, co-author of Daughter of Darkness Under the blazing sun, an elite troupe of dancers are trained to harness their magic. They are the queen&’s most formidable assassins. Aasira has one of the rarest talents – for she is a flame-wielder. Feared by all and envied by some, she uses her power to execute enemies of the crown. Aasira&’s greatest wish is to serve her queen. But on the eve of her graduation, with tensions rising among the dancers and secrets stirring in the shifting sand dunes, she begins to question whether she was truly born to kill… Readers are spellbound by Dancers of the Dawn: &‘Hands down, one of the best books I'll read this year&’ ⭐⭐⭐⭐⭐ &‘a suspenseful, plot twisty and powerfully emotional read that epic fantasy lovers definitely don&’t want to miss.&’ ⭐⭐⭐⭐⭐ &‘Absolutely stellar… I love the sisterhood, the mystery, the characters, the magic.&’ ⭐⭐⭐⭐⭐ &‘an excellent fantasy featuring an original magical system, well developed characters, and a fascinating plot.&’ ⭐⭐⭐⭐⭐ &‘absolutely gorgeous, so evocative that I could practically hear the music and see the dancers, even in their deadliest moments.&’ ⭐⭐⭐⭐⭐ &‘This world is rich, vibrant, and colorful, the prose will transport you to a land full of spices and secrets.&’ ⭐⭐⭐⭐⭐ &‘First of all, dance magic? Such a unique magic system and it was done beautifully! The world was perfectly described, with the spices and the flowers and all the colours. I just adored it!&’ ⭐⭐⭐⭐⭐ &‘A beautifully evoked and action-packed YA adventure, with awe inspiring description of both landscape, magic and dance.&’ ⭐⭐⭐⭐⭐
Dances of José Limón and Erick Hawkins (Routledge Advances in Theatre & Performance Studies)
by James MorenoDances of José Limón and Erick Hawkins examines stagings of masculinity, whiteness, and Latinidad in the work of US modern dance choreographers, José Limón (1908-1972) and Erick Hawkins (1908-1994). Focusing on the period between 1945 to 1980, this book analyzes Limón and Hawkins’ work during a time when modern dance was forming new relationships to academic and governmental institutions, mainstream markets, and notions of embodiment. The pre-war expressionist tradition championed by Limón and Hawkins’ mentors faced multiple challenges as ballet and Broadway complicated the tenets of modernism and emerging modern dance choreographers faced an increasingly conservative post-war culture framed by the Cold War and Red Scare. By bringing the work of Limón and Hawkins together in one volume, Dances of José Limón and Erick Hawkins accesses two distinct approaches to training and performance that proved highly influential in creating post-war dialogues on race, gender, and embodiment. This book approaches Limón and Hawkins’ training regimes and performing strategies as social practices symbiotically entwined with their geo-political backgrounds. Limón’s queer and Latino heritage is put into dialogue with Hawkins’ straight and European heritage to examine how their embodied social histories worked co-constitutively with their training regimes and performance strategies to produce influential stagings of masculinity, whiteness, and Latinidad.
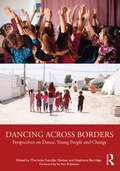
Dancing Across Borders: Perspectives on Dance, Young People and Change
Dancing Across Borders presents formal and non-formal settings of dance education where initiatives in different countries transcend borders: cultural and national borders, subject borders, professional borders and socio-economic borders. It includes chapters featuring different theoretical perspectives on dance and cultural diversity, alongside case narratives that show these perspectives in a specific cultural setting. In this way, each section charts the processes, change and transformation in the lives of young people through dance. Key themes include how student learning is enhanced by cultural diversity, experiential teaching and learning involving social, cross-cultural and personal dimensions. This conceptually aligns with the current UNESCO protocols that accent empathy, creativity, cooperation, collaboration alongside skills- and knowledge-based learning in an endeavour to create civic mindedness and a more harmonious world. This volume is an invaluable resource for teachers, policy makers, artists and scholars interested in pedagogy, choreography, community dance practice, social and cultural studies, aesthetics and interdisciplinary arts. By understanding the impact of these cross-border collaborative initiatives, readers can better understand, promote and create new ways of thinking and working in the field of dance education for the benefit of new generations.
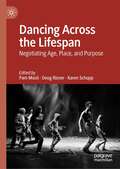
Dancing Across the Lifespan: Negotiating Age, Place, and Purpose
by Karen Schupp Doug Risner Pam MusilThis book critically examines matters of age and aging in relation to dance. As a novel collection of diverse authors’ voices, this edited book traverses the human lifespan from early childhood to death as it negotiates a breadth of dance experiences and contexts. The conversations ignited within each chapter invite readers to interrogate current disciplinary attitudes and dominant assumptions and serve as catalysts for changing and evolving long entrenched views among dancers regarding matters of age and aging.The text is organized in three sections, each representing a specific context within which dance exists. Section titles include educational contexts, social and cultural contexts, and artistic contexts. Within these broad categories, each contributor’s milieu of lived experiences illuminate age-related factors and their many intersections. While several contributing authors address and problematize the phenomenon of aging in mid-life and beyond, other authors tackle important issues that impact young dancers and dance professionals.
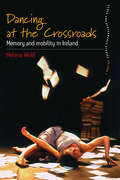
Dancing At The Crossroads
by Helena WulffDancing at the crossroads used to be young people's opportunity to meet and enjoy themselves on mild summer evenings in the countryside in Ireland until this practice was banned by law, the Public Dance Halls Act in 1935. Now a key metaphor in Irish cultural and political life, "dancing at the crossroads" also crystallizes the argument of this book: Irish dance, from Riverdance (the commercial show) and competitive dancing to dance theatre, conveys that Ireland is to be found in a crossroads situation with a firm base in a distinctly Irish tradition which is also becoming a prominent part of European modernity.
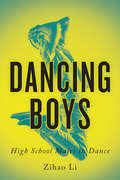
Dancing Boys: High School Males in Dance
by Zihao LiThe challenges that young women go through in order to be successful in the world of dance are well known. However, little is known about the experiences of young men who choose to take dance classes in non-professional settings. Dancing Boys is one of the first scholarly works to demystify the largely unknown challenges of adolescent males in dance. Through an ethnographic study of sixty-two adolescent male students, Zihao Li captures the authentic stories and experiences of boys participating in dance classes in a public high school in Toronto. Accompanied by the boys' artwork and photographs and supported by a documentary-style video, the study explores their motivations for dancing, their reflections on masculinity and gender, and the internal and external factors that impact their decisions to continue to dance professionally or in informal settings. With the author's reflections on his own journey as a professional dancer woven throughout, Dancing Boys will spark discussion on how and why educators can engage adolescent males in dance.