- Table View
- List View
Current Problems of Applied Mathematics and Computer Systems: CPAMCS 2023 (Lecture Notes in Networks and Systems #1044)
by Andrei Tchernykh Irina Samoylenko Anatoly Alikhanov Mikhail BabenkoThis book is based on the best papers accepted for presentation during the International Conference on Current Problems of Applied Mathematics and Computer Systems (APAMCS-2023). The book includes research materials on mathematical problems and solutions in the field of scientific computing, artificial intelligence, data analysis and modular computing. The scope of numerical methods in scientific computing presents original research, including mathematical models and software implementations, related to the following topics: numerical methods in scientific computing; solving optimization problems; methods for approximating functions, etc. The studies in data analysis and modular computing include contributions in the field of deep learning, neural networks, mathematical statistics, machine learning methods, residue number system and artificial intelligence. In addition, some articles focus on mathematical modeling of nonlinear physical phenomena. Finally, the book gives insights into the fundamental problems in mathematics education. The book intends for readership specializing in the field of scientific computing, parallel computing, computer technology, machine learning, information security and mathematical education
Current Research of the Human Interface Society: A Special Issue of the international Journal of Human-computer Interaction
by Osamu KataiThis special issue is the first opportunity to introduce the research activities of the Human Interface Society. The first article gives a microworld approach to identify design requirements for better situation awareness. Next, a focus on evaluation of organizational structure in emergency situations from the communication viewpoints is examined,
Current State of Art in Artificial Intelligence and Ubiquitous Cities
by Rita Yi Man Li Kwong Wing Chau Daniel Chi Wing HoThis book covers artificial intelligence and ubiquitous cities. It discusses the applications of the relevant tools in bringing revolutionary new lives to mankind. It showcases various applications of artificial intelligence in benefiting human society. For example, AI classification shortens the human time required for classifying court cases; humanoid robots help us perform heavy-duty jobs like humans, connect all the smart home devices, and take care of the kids and the elderly. It also presents the application of AutoML to predict housing prices.
Current State of Open Educational Resources in the “Belt and Road” Countries (Lecture Notes in Educational Technology)
by Yuan Gao Rob Koper Ronghuai Huang Dejian Liu Ahmed TliliThis book presents the current state of Open Educational Resources (OER) within the countries covered by the China's Belt and Road Initiative. The authors describe eight aspects of OER development in their countries: infrastructure, policy, resources, open license, curriculum and teaching methodology, outcome, stakeholders and impact. This book also conducts a comparative study between those countries to identify the OER gaps in the Belt and Road countries. It then offers valuable insights and recommendations for several stakeholders, including policy makers and educators, wishing to integrate open educational resources into educational processes, as well as for those involved in inter-regional open educational resources cooperation.
Current Trends and Open Problems in Computational Mechanics
by Christian Weißenfels Fadi Aldakheel Blaž Hudobivnik Meisam Soleimani Henning Wessels Michele MarinoThis Festschrift is dedicated to Professor Dr.-Ing. habil. Peter Wriggers on the occasion of his 70th birthday. Thanks to his high dedication to research, over the years Peter Wriggers has built an international network with renowned experts in the field of computational mechanics. This is proven by the large number of contributions from friends and collaborators as well as former PhD students from all over the world. The diversity of Peter Wriggers network is mirrored by the range of topics that are covered by this book. To name only a few, these include contact mechanics, finite & virtual element technologies, micromechanics, multiscale approaches, fracture mechanics, isogeometric analysis, stochastic methods, meshfree and particle methods. Applications of numerical simulation to specific problems, e.g. Biomechanics and Additive Manufacturing is also covered. The volume intends to present an overview of the state of the art and current trends in computational mechanics for academia and industry.
Current Trends in Biomedical Engineering and Bioimages Analysis: Proceedings of the 21st Polish Conference on Biocybernetics and Biomedical Engineering (Advances in Intelligent Systems and Computing #1033)
by Roman Maniewski Krzysztof Patan Józef Korbicz Marek KowalThis book gathers 30 papers presented at the 21st PCBBE, which was hosted by the University of Zielona Góra, Poland, and offered a valuable forum for exchanging ideas and presenting the latest developments in all areas of biomedical engineering. Biocybernetics and biomedical engineering are currently considered one of the most promising ways to improve health care and, consequently, the quality of life. Innovative technical solutions can better meet physicians’ needs and stimulate the development of medical diagnostics and therapy. We are currently witnessing a profound change in the role of medicine, which is becoming ubiquitous in everyday life thanks to technological advances. Further, the development of civilization manifests itself in efforts to unlock the secrets of the human body, and to mimic biological systems in engineering. The biannual Polish Conference on Biocybernetics and Biomedical Engineering (PCBBE) has been held for nearly four decades and has attracted scientists and professionals in the fields of engineering, medicine, physics, and computer science. Gathering the outcomes of this conference, the book introduces the reader to recent developments and achievements in biocybernetics and biomedical engineering.
Current Trends in Semantic Web Technologies: Theory and Practice (Studies in Computational Intelligence #815)
by Rafael Valencia-García Giner Alor-Hernández José Luis Sánchez-Cervantes Alejandro Rodríguez-GonzálezThis book presents innovative and high-quality research regarding the implementation of Semantic Web technologies for knowledge representation and developing intelligent applications in various domains. Semantic Web technologies have inspired many people to create innovative technologies and applications for knowledge representation, Semantic Searches, NLP and Social Networks. The goal of this book is to collect and consolidate novel and high-quality research contributions on Semantic Web technologies and their theoretical and practical application to a range of different domains. In addition to researchers, the book offers a valuable resource for PhD students, master and undergraduate students in IT-related fields such as Computer Science and Information Systems.
Current Trends in Web Engineering: ICWE 2016 International Workshops, DUI, TELERISE, SoWeMine, and Liquid Web, Lugano, Switzerland, June 6-9, 2016. Revised Selected Papers (Lecture Notes in Computer Science #9881)
by Cesare Pautasso Sven Casteleyn Peter DologThis book constitutes the thoroughly refereed post-workshop proceedings of the 16th International Conference on Web Engineering, ICWE 2016, held in Lugano, Switzerland, in June 2016. The 15 revised full papers together with 5 short papers were selected form 37 submissions. The workshops complement the main conference, and provide a forum for researchers and practitioners to discuss emerging topics. As a result, the workshop committee accepted six workshops, of which the following four contributed papers to this volume: 2nd International Workshop on TEchnical and LEgal aspects of data pRIvacy and SEcurity (TELERISE 2016) 2nd International Workshop on Mining the Social Web (SoWeMine 2016) 1st International Workshop on Liquid Multi-Device Software for the Web (LiquidWS 2016) 5th Workshop on Distributed User Interfaces: Distributing Interactions (DUI 2016)
Current Trends in Web Engineering: ICWE 2018 International Workshops, MATWEP, EnWot, KD-WEB, WEOD, TourismKG, Cáceres, Spain, June 5, 2018, Revised Selected Papers (Lecture Notes in Computer Science #11153)
by Cesare Pautasso Fernando Sánchez-Figueroa Kari Systä Juan Manuel Murillo RodríguezThis book constitutes the refereed thoroughly refereed post-workshop proceedings of the 18th International Conference on Web Engineering, ICWE 2018, held in Cáceres, Spain, in June 2018. The 18 revised full papers were selected from 40 submissions. The workshops complement the main conference and explore new trends on core topics of Web engineering and provide an open discussion space combining solid theory work with practical on-the-field experience. The workshop committee accepted five workshops for publication in this volume: First International Workshop on Maturity of Web Engineering Practices (MATWEP 2018), Second International Workshop on Engineering theWeb of Things (EnWoT 2018), Fourth International Workshop on Knowledge Discovery on the Web (KDWEB 2018), International Workshop on Engineering Open Data (WEOD 2018), First International Workshop on Knowledge Graphs on Travel and Tourism (TourismKG 2018).
Current Trends in Web Engineering: ICWE 2019 International Workshops, DSKG, KDWEB, MATWEP, Daejeon, South Korea, June 11, 2019, Proceedings (Lecture Notes in Computer Science #11609)
by Marco Brambilla Cinzia Cappiello Siew Hock OwThis book constitutes the thoroughly refereed post-workshop proceedings of the 19th International Conference on Web Engineering, ICWE 2019, held in Daejeon, South Korea, in June 2019. The 11 revised full papers were selected from 25 submissions. The workshops complement the main conference and explore new trends on core topics of Web engineering and provide an open discussion space combining solid theory work with practical on-the-field experience. The workshop committee accepted three workshops for publication in this volume: 5th International Workshop on Knowledge Discovery on the Web (KDWEB 2019), Second International Workshop on Maturity of Web Engineering Practices (MATWEP 2019), International Workshop on Data Science and Knowledge Graph (DSKG 2019).
Current Trends in Web Engineering: ICWE 2020 International Workshops, KDWEB, Sem4Tra, and WoT4H, Helsinki, Finland, June 9–12, 2020, Revised Selected Papers (Lecture Notes in Computer Science #12451)
by In-Young Ko Juan Manuel Murillo Petri VuorimaaThis book constitutes the thoroughly refereed post-workshop proceedings of the 20th International Conference on Web Engineering, ICWE 2020, held in Helsinki, Finland, in June 2020.*The 4 revised full 4 revised short papers were selected from 10 submissions. The workshops complement the main conference and explore new trends on core topics of Web engineering and provide an open discussion space combining solid theory work with practical on-the-field experience. The workshop committee accepted three workshops for publication in this volume: 1st International Workshop on the Web of Things for Humans (WoT4H 2020), 2nd Semantics and the Web for Transport workshop (Sem4Tra 2020), and 6th International Workshop on Knowledge Discovery on the Web (KDWEB 2020). *The conference was held virtually due to the COVID-19 pandemic.
Current Trends in Web Engineering: ICWE 2022 International Workshops, BECS, SWEET and WALS, Bari, Italy, July 5-8, 2022, Revised Selected Papers (Communications in Computer and Information Science Series #1668)
by Cinzia Cappiello Giuseppe Agapito Anna Bernasconi Hasan Ali Khattak InYoung Ko<p>This volume constitutes the papers of several workshops which were held in conjunction with the ICWE 2022 International Workshops, BECS, SWEET and WALS, held in Bari, Italy, July 5–8, 2022. The 14 revised full papers and 1 short paper presented in this book were carefully reviewed and selected from 25 submissions.<p> <p>ICWE 2022 presents the following three workshops:<p> <p>Second International Workshop on Big Data driven Edge Cloud Services (BECS 2022)<p> <p>First International Workshop on the Semantic WEb of Everything (SWEET 2022)<p> <p>First International Workshop on Web Applications for Life Sciences (WALS 2022)<p>
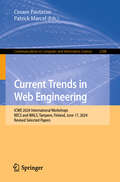
Current Trends in Web Engineering: ICWE 2023 International Workshops: BECS, SWEET, WALS, Alicante, Spain, June 6–9, 2023, Revised Selected Papers (Communications in Computer and Information Science #1898)
by Sven Casteleyn Tommi Mikkonen In-Young Ko Giuseppe Loseto Alberto García SimónThis volume constitutes the papers of several workshops which were held in conjunction with the International Conference on Web Engineering, ICWE 2023, held in Alicante, Spain, in June 6–9, 2023.The 10 revised full papers and 2 short papers presented in this book were carefully reviewed and selected from 23 submissions. They stem from the following workshops:Third International Workshop on Big Data Driven Edge Cloud Services (BECS 2023) Second International Workshop on the Semantic Web of Everything (SWEET 2023) Second International Workshop on Web Applications for Life Sciences (WALS2023)
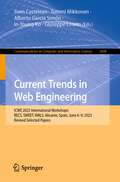
Current Trends in Web Engineering: ICWE 2024 International Workshops, BECS and WALS, Tampere, Finland, June 17, 2024, Revised Selected Papers (Communications in Computer and Information Science #2188)
by Cesare Pautasso Patrick MarcelThis volume constitutes the papers of two workshops which were held in conjunction with the International Conference on Web Engineering, ICWE 2024, held in Tampere, Finland, on June 17, 2024. The 6 revised full papers and 2 short papers presented in this book were carefully reviewed and selected from 14 submissions. They stem from the following workshops: Fourth International Workshop on Big Data Driven Edge Cloud Services (BECS 2024) Third International Workshop on Web Applications for Life Sciences (WALS 2024)
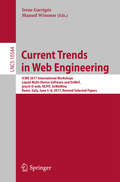
Current Trends in Web Engineering: Icwe 2012 International Workshops Mdwe, Composableweb, Were, Qwe, And Doctoral Consortium, Berlin, Germany, July 2012, Revised Selected Papers (Lecture Notes In Computer Science / Information Systems And Applications, Incl. Internet/web, And Hci Ser. #7703)
by Manuel Wimmer Irene GarrigósThis book constitutes the refereed thoroughly refereed post-workshop proceedings of the 17th International Conference on Web Engineering, ICWE 2017, held in Rome, Italy, in June 2017.The 24 revised full papers were selected from 34 submissions. The workshops complement the main conference, and explore new trends on core topics of Web engineering. The workshop committee accepted five workshops of which the following four contributed papers to this volume: - 2nd International Workshop on Liquid Multi-Device Software and 1st International Workshop on Engineering the Web of Things - International Workshop on The Practice Of The Open Web (practi-O-web 2017) - 3rd International Workshop on Natural Language Processing for Informal Text (NLPIT 2017)- 3rd International Workshop on Mining the Social Web (SoWeMine 2017).
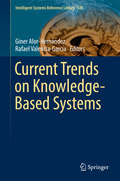
Current Trends on Knowledge-Based Systems (Intelligent Systems Reference Library #120)
by Rafael Valencia-García Giner Alor-HernándezThis book presents innovative and high-quality research on the implementation of conceptual frameworks, strategies, techniques, methodologies, informatics platforms and models for developing advanced knowledge-based systems and their application in different fields, including Agriculture, Education, Automotive, Electrical Industry, Business Services, Food Manufacturing, Energy Services, Medicine and others. Knowledge-based technologies employ artificial intelligence methods to heuristically address problems that cannot be solved by means of formal techniques. These technologies draw on standard and novel approaches from various disciplines within Computer Science, including Knowledge Engineering, Natural Language Processing, Decision Support Systems, Artificial Intelligence, Databases, Software Engineering, etc. As a combination of different fields of Artificial Intelligence, the area of Knowledge-Based Systems applies knowledge representation, case-based reasoning, neural networks, Semantic Web and TICs used in different domains. The book offers a valuable resource for PhD students, Master’s and undergraduate students of Information Technology (IT)-related degrees such as Computer Science, Information Systems and Electronic Engineering.
Current and Future Cellular Systems: Technologies, Applications, and Challenges
by Shalli Rani Garima Chopra Suhaib AhmedComprehensive reference on the latest trends, solutions, challenges, and future directions of 5G communications and beyond Current and Future Cellular Systems: Technologies, Applications, and Challenges covers the state of the art in architectures and solutions for 5G wireless communication and beyond. This book is unique because instead of focusing on singular topics, it considers various technologies being used in conjunction with 5G and beyond 5G technologies. All new and emerging technologies are covered, along with their problems and how quality of service (QoS) can be improved with respect to future requirements. This book highlights the latest trends in resource allocation techniques due to different device (or user) characteristics, provides a special focus on wide bandwidth millimeter wave communications including circuitry, antennas, and propagation, and discusses the involvement of decision-making processes assisted by artificial intelligence/machine learning (AI/ML) in applications such as resource allocation, power allocation, QoS improvement, and autonomous vehicles. Readers will also learn to develop mathematical modeling, perform simulation setup, and configure parameters related to simulations. Current and Future Cellular Systems includes information on: The Internet of Vehicles (IoV), covering requirements, challenges, and limitations of Cellular Vehicle-to-Everything (C-V2X) with Resource Allocation (RA) techniquesIntelligent reflecting surfaces, unmanned aerial vehicles, power optimized frameworks, challenges in a sub-6 GHz band, and communication in a THz bandThe role of IoT in healthcare, agriculture, smart home applications, networking requirements, and the metaverseQuantum computing, cloud computing, spectrum sharing methods, and performance analysis of WiFi 6/7 for indoor and outdoor environments Providing expansive yet accessible coverage of the subject by exploring both basic and advanced topics, Current and Future Cellular Systems serves as an excellent introduction to the fundamentals of 5G and its applications for graduate students, researchers, and industry professionals in the field of wireless communication technologies.
Current and Future Trends in Health and Medical Informatics (Studies in Computational Intelligence #1112)
by Kevin Daimi Abeer Alsadoon Sara Seabra Dos ReisThis book is comprehensive with most of its contents following the recommendations of international health and medical informatics associations and societies. To this extent it covers the areas of healthcare and medical information systems, management of healthcare and medical information systems, healthcare/medical information systems supporting patients and the public, healthcare/medical networking and care sharing, medical imaging and 3D/4D surgical visualization, design and analysis of health/medical records, health/medical data representation and analysis, simulation and modeling in healthcare, and health and medical informatics education.The book provides an excellent professional development resource for educators and practitioners on the state-of-the-art Health and Medical Informatics. It covers many areas and topics of Health and Medical Informatics and contributes toward the enhancement of the community outreach and engagement component of Health and Medical Informatics. Various techniques, methods, and approaches adopted by Health and Medical Informatics experts in the field are introduced. Furthermore, it provides detailed explanation of the Health and Medical Informatics concepts that are aptly reinforced by applications and some practical examples and a road map of future trends that are suitable for innovative Health and Medical Informatics.
Current and Future Trends of Rainfall Erosivity and Soil Erosion in Central Asia (SpringerBriefs in Environmental Science)
by Xi Chen Gulnura Issanova Eldiiar Duulatov Rustam Orozbaev Yerbolat Mukanov Amobichukwu C. AmanambuThis book analyses climate change influences on rainfall erosivity and soil erosion across Central Asia, provides an overview (past and projections) on the Central Asian countries where projected changes in rainfall erosivity and erosivity density are the greatest, and discusses the potential impacts on the environment across the region. This analysis is accomplished primarily using the RUSLE model with past and future climate projections, spatiotemporal variations of rainfall erosivity and soil erosion based on WorldClim, and Coupled Model Intercomparison Project Phase 5 (CMIP5) climate models (for Central Asia and separately Kazakhstan). The relationship between precipitation characteristics and erosion has been well established, but spatial and temporal projections of future rainfall erosivity in a changing climate in Central Asia have not been published significantly. Therefore, assessing rainfall erosivity and its consequences can assist specialists and researchers in achieving the best practices for soil conservation. The result of this type of research is all-encompassing, and may reflect normal variations in other parts of the world (for example, the arid and semi-arid regions) and is inherently limited to the Central Asian region.
Current and Future Trends on AI Applications: Volume 1 (Studies in Computational Intelligence #1178)
by Mostafa Al-Emran Ibrahim Arpaci Mohammed A. Al-Sharafi Moamin A. MahmoudThis book offers a deep dive into cutting-edge advancements and emerging trends that are reshaping industries and society. From healthcare and cybersecurity to disaster management and energy informatics, this book brings together expert insights and real-world applications, showcasing AI’s profound impact and boundless potential. Perfect for researchers, practitioners, and students alike, this comprehensive guide not only highlights current innovations but also provides a forward-looking perspective on how AI will drive the next wave of technological breakthroughs.
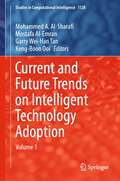
Current and Future Trends on Intelligent Technology Adoption: Volume 1 (Studies in Computational Intelligence #1128)
by Mostafa Al-Emran Mohammed A. Al-Sharafi Garry Wei-Han Tan Keng-Boon OoiThis book explores current and future trends in adopting intelligent technologies, such as the metaverse, social technologies, FinTech applications, and blockchain, among individuals and organizations. The edited book includes empirical and review studies primarily focusing on these issues. This focus aids scholars in conducting future research in the domain and identifying possible future developments of emerging technologies. The empirical studies in the book utilize recent and advanced analytical techniques for data analysis.
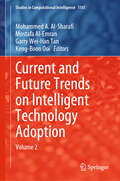
Current and Future Trends on Intelligent Technology Adoption: Volume 2 (Studies in Computational Intelligence #1161)
by Mostafa Al-Emran Mohammed A. Al-Sharafi Garry Wei-Han Tan Keng-Boon OoiThis book explores current and future trends in adopting intelligent technologies among individuals and organizations. The edited book includes empirical and review studies primarily focusing on these issues. This focus aids scholars in conducting future research in the domain and identifying possible future developments of emerging technologies. The empirical studies in the book utilize recent and advanced analytical techniques for data analysis.
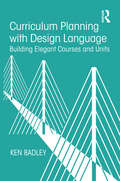
Curriculum Planning with Design Language: Building Elegant Courses and Units
by Ken BadleyCurriculum Planning with Design Language provides a streamlined, adaptable framework for using visual design terminology to conceptualize instructional design objectives, processes, and strategies. Drawing from instructional design theory, pattern language theory, and aesthetics, these ten course and unit design principles help educators break down and clarify their broader planning tasks and concerns. Written in clear, direct prose and rich with intuitive examples, this book showcases insights leading to effective curriculum design that will speak equally to pre-service and experienced educators.
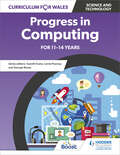
Curriculum for Wales: Progress in Computing for 11-14 years
by Gareth Evans George Rouse Lorne PearceyConfidently deliver Computing for the new Curriculum for Wales and develop students' ICT skills with the interactive, accessible, and flexible Progress in Computing: Boost eBook.Reboot your Computing classroom with this all-in-one textbook, informed by the new curriculum progression steps, that will inspire you to deliver creative Computing lessons with confidence.Boost knowledge and skills in bite-sized chunks: every double-page spread contains a lesson's worth of targeted content and activitiesChallenge students to think creatively about what they are learning and how it can be applied in the real worldEmpower and encourage students to think take charge of their own progression, with regular knowledge check-ins and activitiesPrepare for the new curriculum with informed coverage of the Computing What Matters statement: 'Computation is the foundation for our digital world'