- Table View
- List View
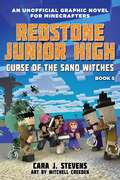
Curse of the Sand Witches: Redstone Junior High #5 (Redstone Junior High #5)
by Cara J. StevensWhen word gets out that Redstone Junior High is a hot spot for hostile mobs, enrollment goes up and chaos is the new normal. To get away from all the stress, Pixel, Sky, Uma, and Violet find themselves sneaking off through a secret mine tunnel to a beach-filled paradise they discovered. Little do they know that they are trespassing on the territory of two very angry witches: Grindel and Agatha. The witches watch them from the shadows and vow to reclaim their beach by any means necessary. What starts out as mischievous tricks and upside-down spells escalates to a vengeful plan to take over the entire school. Survival skills have become the new academic focus at the school. As the kids learn to farm, build invisible shelters, and battle horrible beasts, bizarre things begin happening all around them and they must use their newfound skills to survive. Armed only with an unreliable book of enchantment and what they’ve learned so far at Redstone Junior High, they must work together to escape killer cave spiders, a skeleton ambush, and a fierce army of golems. Will they figure out why the beach feels haunted, uncover the secret of the sand witches, and discover why the principal is acting so crazy, or will Grindel and Agatha take over the school and enslave the students forever?
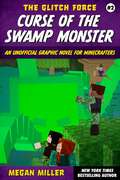
Curse of the Swamp Monster: An Unofficial Graphic Novel for Minecrafters (The Glitch Force #2)
by Megan MillerThe second book in the all-new Glitch Force series for Minecrafters!The Glitch Force: Three kids interested in Minecraft. There&’s Duncan, a genius redstoner, Miranda, a sharpshooter with encyclopedic knowledge of Minecraft, and Zed, an expert builder with a prankster heart. Oh, and Duncan happens to a genius at repurposing his scientist mother's quantum electronic gizmos. When he happens to find a quantum glitch in the Minecraft programming code, it creates an opening for the three kids to visit Minecraft worlds FOR REAL. The problem is, the glitch technology isn't quite stable yet, and dangerous anomalies in their new world threaten their ability to return home. They will have to repair each world before they have any chance of returning to reality. There&’s rumor of a major anomaly in a swamp in Sector Z-D71508, and the Glitch Force must investigate. Everything looks normal, until nighttime, when a bubbling green ooze begins to seep from the swamp, infecting everything it touches. But Miranda, Zed, and Duncan&’s efforts to contain it only make the problem worse—The green slime solidifies and mutates into an enormous hostile mob that engulfs everything in its path. But is this green swamp monster the real enemy? A frog tornado, a pack of hissing feral cats, and a hidden trove of deadly potions suggest that the anomaly is more complicated than they imagined.
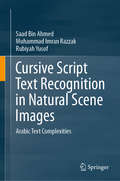
Cursive Script Text Recognition in Natural Scene Images: Arabic Text Complexities
by Saad Bin Ahmed Muhammad Imran Razzak Rubiyah YusofThis book offers a broad and structured overview of the state-of-the-art methods that could be applied for context-dependent languages like Arabic. It also provides guidelines on how to deal with Arabic scene data that appeared in an uncontrolled environment impacted by different font size, font styles, image resolution, and opacity of text. Being an intrinsic script, Arabic and Arabic-like languages attract attention from research community. There are a number of challenges associated with the detection and recognition of Arabic text from natural images. This book discusses these challenges and open problems and also provides insights into the complexities and issues that researchers encounter in the context of Arabic or Arabic-like text recognition in natural and document images. It sheds light on fundamental questions, such as a) How the complexity of Arabic as a cursive scripts can be demonstrated b) What the structure of Arabic text is and how to consider the features from a given text and c) What guidelines should be followed to address the context learning ability of classifiers existing in machine learning.
Curves and Surfaces
by Larry L. Schumaker Pierre-Jean Laurent Alain Le MéhautéThis volume documents the results and presentations, related to aspects of geometric design, of the Second International Conference on Curves and Surfaces, held in Chamonix in 1993. The papers represent directions for future research and development in many areas of application. From the table of contents: - Object Oriented Spline Software - An Int
Curves and Surfaces (UNITEXT)
by M. Abate F. TovenaThe book provides an introduction to Differential Geometry of Curves and Surfaces. The theory of curves starts with a discussion of possible definitions of the concept of curve, proving in particular the classification of 1-dimensional manifolds. We then present the classical local theory of parametrized plane and space curves (curves in n-dimensional space are discussed in the complementary material): curvature, torsion, Frenet's formulas and the fundamental theorem of the local theory of curves. Then, after a self-contained presentation of degree theory for continuous self-maps of the circumference, we study the global theory of plane curves, introducing winding and rotation numbers, and proving the Jordan curve theorem for curves of class C2, and Hopf theorem on the rotation number of closed simple curves. The local theory of surfaces begins with a comparison of the concept of parametrized (i.e., immersed) surface with the concept of regular (i.e., embedded) surface. We then develop the basic differential geometry of surfaces in R3: definitions, examples, differentiable maps and functions, tangent vectors (presented both as vectors tangent to curves in the surface and as derivations on germs of differentiable functions; we shall consistently use both approaches in the whole book) and orientation. Next we study the several notions of curvature on a surface, stressing both the geometrical meaning of the objects introduced and the algebraic/analytical methods needed to study them via the Gauss map, up to the proof of Gauss' Teorema Egregium. Then we introduce vector fields on a surface (flow, first integrals, integral curves) and geodesics (definition, basic properties, geodesic curvature, and, in the complementary material, a full proof of minimizing properties of geodesics and of the Hopf-Rinow theorem for surfaces). Then we shall present a proof of the celebrated Gauss-Bonnet theorem, both in its local and in its global form, using basic properties (fully proved in the complementary material) of triangulations of surfaces. As an application, we shall prove the Poincaré-Hopf theorem on zeroes of vector fields. Finally, the last chapter will be devoted to several important results on the global theory of surfaces, like for instance the characterization of surfaces with constant Gaussian curvature, and the orientability of compact surfaces in R3.

Curves and Surfaces: 8th International Conference, Paris, France, June 12-18, 2014, Revised Selected Papers (Lecture Notes in Computer Science #9213)
by Albert Cohen Tom Lyche Larry L. Schumaker Jean-Daniel Boissonnat Olivier Gibaru Christian Gout Marie-Laurence MazureThis volume constitutes the thoroughly refereed post-conference proceedings of the 8th International Conference on Curves and Surfaces, held in Paris, France, in June 2014. The conference had the overall theme: "Representation and Approximation of Curves and Surfaces and Applications". The 32 revised full papers presented were carefully reviewed and selected from 39 submissions. The scope of the conference was on following topics: approximation theory, computer-aided geometric design, computer graphics and visualization, computational geometry and topology, geometry processing, image and signal processing, interpolation and smoothing, mesh generation, finite elements and splines, scattered data processing and learning theory, sparse and high-dimensional approximation, subdivision, wavelets and multi-resolution method.
Cusped Shell-Like Structures (SpringerBriefs in Applied Sciences and Technology)
by George JaianiThe book is devoted to an up-dated exploratory survey of results concerning elastic cusped shells, plates, and beams and cusped prismatic shell-fluid interaction problems. It contains some up to now non-published results as well. Mathematically the corresponding problems lead to non-classical, in general, boundary value and initial-boundary value problems for governing degenerate elliptic and hyperbolic systems in static and dynamical cases, respectively. Its uses two fundamentally different approaches of investigation: 1) to get results for two-dimensional and one-dimensional problems from results of the corresponding three-dimensional problems and 2) to investigate directly governing degenerate and singular systems of 2D and 1D problems. In both the cases, it is important to study relation of 2D and 1D problems to 3D problems.
Custodians of the Internet: Platforms, Content Moderation, and the Hidden Decisions That Shape Social Media
by Tarleton GillespieA revealing and gripping investigation into how social media platforms police what we post online—and the large societal impact of these decisions Most users want their Twitter feed, Facebook page, and YouTube comments to be free of harassment and porn. Whether faced with “fake news” or livestreamed violence, “content moderators”—who censor or promote user†‘posted content—have never been more important. This is especially true when the tools that social media platforms use to curb trolling, ban hate speech, and censor pornography can also silence the speech you need to hear. In this revealing and nuanced exploration, award†‘winning sociologist and cultural observer Tarleton Gillespie provides an overview of current social media practices and explains the underlying rationales for how, when, and why these policies are enforced. In doing so, Gillespie highlights that content moderation receives too little public scrutiny even as it is shapes social norms and creates consequences for public discourse, cultural production, and the fabric of society. Based on interviews with content moderators, creators, and consumers, this accessible, timely book is a must†‘read for anyone who’s ever clicked “like” or “retweet.”
Custom Components in Architecture: Strategies for Customizing Repetitive Manufacturing
by Dana GullingThis book offers architects strategies in the design and manufacturing of custom, repetitively manufactured building components.A total of 36 case studies from around the globe demonstrate the diversity of CRM in architecture and are contributed by architecture firms, including Diller Scofidio + Renfro, Kengo Kuma & Associates, Abin Design Studio, Behnisch Architekten, Belzberg Architects, and many more. The book is organized by manufacturing process and covers the use of various types of glass, clay, plastic, metal, wood, plaster, and concrete. Each process is described with diagrams and text and expanded with one or more examples of customized building components. Projects included are of buildings of various types, sizes, and clients, and many deviate from the typical manufacturing process as they include a secondary process (e.g. casting glass, then slumping it), special tooling modifications (e.g. dams used to subdivide a mold), post-production processes, or other notable manufacturing features. Each case study includes a project overview, behind‐the‐scenes images of the component manufacturing, and original diagrams that illustrate how those components were customized.Custom Components in Architecture will be essential reading for any architect interested in building design details and keeping up-to-speed on material advances. Upper-level students of digital architecture, fabrication, and building technology will also find this a useful tool.
Custom Fiori Applications in SAP HANA: Design, Develop, and Deploy Fiori Applications for the Enterprise
by Sergio GuerreroGet started building custom Fiori applications for your enterprise. This book teaches you how to design, build, and deploy enterprise-ready, custom Fiori applications in SAP HANA. Tips and tricks collected from projects using Fiori applications (built consuming OData models and REST APIs) and integrating third-party JS libraries are presented. Also included are examples using Fiori templates from different tools such as the SAP Web IDE and the new Visual Studio Code extensions. This book explains the 5 design principles that all Fiori applications are built upon: Role-based, Responsive, Coherent, Simple, and Delightful. The book expands on consuming OData services and REST APIs internal and external to SAP HANA. The Fiori application exercise demonstrates the use of the MVC pattern, JavaScript modularization, reuse of SAP UI5 controls, debugging, and the tools required for a complete scenario. The book closes with an exercise showcasing a finished single page application with multiple views and layouts, navigation between the views, and deployment of the application to AWS. This book is simple enough for entry-level developers getting started in web frameworks but also highlights integration points from the data models being consumed from the application, and shows how the application communicates with back-end services, resulting in a complete front-end custom Fiori application.What You Will LearnKnow the 5 Fiori design principlesUnderstand how to consume OData and REST API modelsApply the MVC pattern using XML views and the SAP UI5 controls along with controller behavior in JavaScriptDebug and deploy the applicationWho This Book is ForWeb developers and application leads who have some experience in JavaScript frameworks and web development and understand web protocol communication
Custom Raspberry Pi Interfaces: Design and build hardware interfaces for the Raspberry Pi
by Warren GayDesign and build custom hardware interfaces for the Raspberry Pi and discover low cost display and sensor options for embedded system projects. With this book you'll master 12C communications using Raspbian Linux in C++ and perform ADC and DAC experiments. You'll experiment with debounce buttons and switches using hardware and software solutions. Develop flywheel rotary encoder effects for ease of tuning and construct a hardware interface to the Music Playing Daemon (MPD) with developed software. Discover how to add your own hardware keypad for remote combination lock applications. Custom Raspberry Pi Interfaces offers a thorough chapter on interfacing 5-volt systems to 3. 3-volt Raspberry Pis designed to expand your choice of peripheral options. Ready to go C++ programs involving GPIO and I2C peripherals are provided. This book also explores ADC, DAC, rotary encoders, CMOS shift registers. I2C I/O extenders. What you'll learn: Build simple, low cost input/output interfaces including rotary encoders Interface with 5-volt devices from a 3-volt Raspberry Pi system Apply analog to digital and digital to analog conversions on the Pi Read potentiometers (volume control) from the Pi Determine step, directions, and velocity of a rotary encoder Perform remote interfacing using the I2 PCF8574 chip Work with external CMOS devices like the 74HC595 (in C++) Who this book is for:Students and hobbyists interested in building custom interfaces for their Raspberry Pis.
Custom Search - Discover more: A Complete Guide to Google Programmable Search Engines
by Irina Shamaeva David Michael GalleyGoogle’s Programmable Search Engines (PSEs, previously called Custom Search Engines) provide search opportunities that are unavailable with any other tool. PSEs have advanced settings and search operators that are not supported by "regular" Google. With PSEs, it is possible to perform filtered searches within parts of the web as if they were databases! While lots of professionals use existing PSEs to source for talent or with other research goals, few people have experience creating them. Even fewer know about powerful PSE-only search operators. The main reason PSEs are not as popular as they should be is that it is not easy to get educated on PSE creation. There is little information online and no books (other than this one) on the subject. Even less info is available on the "structured" operators that allow for filtered searches. The first of its kind, this book hopes to popularize these fun and powerful tools so that many more people can include PSEs in their work. Key Features: A detailed introduction to creating PSEs, including info absent in Google’s help A "hack" for creating PSEs that look for profiles in seconds An introduction to advanced PSE-only search operators allowed to perform filtered searches of parts of the web A "hack" for expanding Google’s search limits to 500 terms Use cases, examples, and approaches that would be educational for those doing online research This book will be of interest to researchers, OSINT specialists, investigative journalists, Competitive Intelligence people, recruiters, and Sourcers, to name a few categories, and to the general public interested in how to search better.
Custom SharePoint Solutions with HTML and JavaScript: For SharePoint On-Premises and SharePoint Online
by Brandon AtkinsonCustom SharePoint Solutions with HTML and JavaScript shows you how to build and customize SharePoint solutions to suit a wide range of business needs. You don't need a background in Microsoft technologies; you'll learn how to rapidly build and customize sites entirely on the front end, starting with out-of-the-box features and extending them with HTML and JavaScript code. The book starts with an introduction to working with SharePoint on the front end, and how this can help you avoid common pitfalls associated with deploying custom code on the server. You'll start by using SharePoint's browser-based tools to place and manipulate out-of-the-box web parts on a page. Then learn to inject some simple HTML and JavaScript to manipulate these web parts, and use JSLink to rapidly style and manipulate data in the List web part. You'll also see examples of how to build your own custom web parts using HTML, JavaScript and CSS. For those who want to dive deeper into JavaScript on SharePoint, chapters cover working directly with built-in JavaScript methods and properties and the JavaScript object model (JSOM), and how to work with the powerful new REST API, which gives you the ultimate flexibility over what you do with your data. Whatever your background, whether it's web development, working with SharePoint on the server side, or if you're a SharePoint user looking to learn new skills, Custom SharePoint Solutions with HTML and JavaScript will show you how to get what you want from SharePoint, quickly and reliably. What you'll learn Understand the advantages of working with SharePoint on the front end, using HTML and JavaScript. Use the Content Editor and Script Editor web parts to customize your front end directly in the browser. Work with SharePoint's built-in JavaScript methods and properties and the JavaScript object model. Access and manipulate data using the powerful REST API. Build your own custom web parts. Use JSLink to style and manipulate list data. Who this book is for Web or front end developers, . NET developers, and SharePoint users. No prior JavaScript experience is needed for many of the OOTB solutions, but a little is desirable if you want to make the most of what the customizations offer. Experienced JavaScript developers will additionally benefit from the deep dives into JavaScript features in Chapters 4-6. Table of Contents Chapter 1: Setting Up Your Environment Chapter 2: Introduction to SharePoint Front End Solutions Chapter 3: Content Editor and Script Editor Web Parts Chapter 4: Working With SharePoint's Built-in JavaScript Methods and Properties Chapter 5: The JavaScript Object Model Chapter 6: Working With Data Using the REST API Chapter 7: Building Custom Web Parts Using HTML and JavaScript Chapter 8: Using JSLink to Style List Web Parts Chapter 9: Content Search Web Part and Display Templates
Customer Accounting: Creating Value With Customer Analytics (Springerbriefs In Accounting Ser.)
by Paolo Perego Massimiliano BonacchiThis book is designed to meet the needs of CFOs, accounting and financial professionals interested in leveraging the power of data-driven customer insights in management accounting and financial reporting systems. While academic research in Marketing has developed increasingly sophisticated analytical tools, the role of customer analytics as a source of value creation from an Accounting and Finance perspective has received limited attention. The authors aim to fill this gap by blending interdisciplinary academic rigor with practical insights from real-world applications. Readers will find thorough coverage of advanced customer accounting concepts and techniques, including the calculation of customer lifetime value and customer equity for internal decision-making and for external financial reporting and valuation. Beyond a professional audience, the book will serve as ideal companion reading for students enrolled in undergraduate, graduate, or MBA courses.
Customer Behaviour in eCommerce: Case Studies from the Online Grocery Market (SpringerBriefs in Business)
by Šárka Zapletalová Halina StarzycznáOnline shopping is undergoing significant changes around the globe, evolving in the food and non-food segments alike. Representing a vital distribution channel that reaches countless customers, sales from online shopping have long-since exceeded USD 1000 billion per year and are growing steadily. This book is intended for general readers and professionals interested in companies’ strategic orientation in connection with their online format and building and strengthening customer loyalty. In this regard, their business strategies are not considered in their full scope and complexity; instead, the book focuses more narrowly on the relationship between business strategy, buying behavior and customer loyalty.
Customer Centricity: Innovative Unternehmenspraxis: Insights, Strategien und Impulse
by Gabriele Schuster Susanne O’GormanDieses Buch schlägt eine Brücke zwischen wissenschaftlicher Forschung zu Customer Centricity und ihrer praxisorientierten Anwendung. Das Interesse und die Begeisterung für Customer Centricity sind seit einigen Jahren ungebrochen, doch trotz reger Forschungstätigkeit und großem Interesse aus der Praxis scheitern viele Unternehmen nach wie vor an der Umsetzung. Zahlreiche Beitragsautor:innen betrachten in diesem Buch sowohl die Perspektive der Konsument:innen als auch der Unternehmen und integrieren zukunftsorientierte Ansätze wie Design Thinking, Augmented/Virtual Reality und CX-Plattformen. Die Leser:innen erhalten wissenschaftlich fundierte Handlungsempfehlungen für ein kundenzentriertes Unternehmen von praxiserfahrenen Expert:innen.Mit Beiträgen von:Prof. Dr. Laura-Maria AltendorferElaine BecraftProf. Dr. Thomas BolzProf. Dr. Benny BriesemeisterChristian FeddersenCharlotte FietzLivia FreudlTim GnanntProf. Dr. Stefan Godehardt-BestmannDr. Gregor ElbelProf. Dr. Katja GruppMatthias HackenbrachtProf. Dr. Cansu HattulaProf. Dr. Clare HindleyProf. Dr. Nicole KleinProf. Dr. Alexandra KühtePhilip MaloneyProf. Dr. Rico ManßProf. Dr. Astrid MühlböckProf. Dr. Bettina-Maria Müller Prof. Dr. Miriam O’SheaProf. Dr. Katharina RehfeldProf. Dr. Christian SchachtnerProf. Dr. Katrin E. ScheinProf. Dr. Uta ScheunertProf. Dr. Inga F. SchlömerProf. Dr. Benjamin Schulte Stephan SchusserMelanie StehrDr. Sascha TammTimo ThuencherNeal WesslingProf. Dr. Annegret Wittmann-Wurzer Prof. Dr. Nicola ZechProf. Dr. Matthias ZeisbergDr. Li Zeng
Customer Engagement and Digital Business (Routledge Studies in Marketing)
by Jamid Ul IslamIn an age where digital disruptions rewrite the rules of commerce, Customer Engagement and Digital Business presents a timely and cutting-edge examination of how businesses must rethink engagement to thrive. This edited volume brings together a diverse group of international scholars who explore the evolving dynamics of customer engagement across a variety of technological, social, and ethical landscapes.Spanning conceptual frameworks, empirical studies, and emerging paradigms, the chapters address both the bright and dark sides of engagement in the digital age. From the emotional resonance of AI-powered brand interactions to the immersive experiences enabled by VR and Metaverse, this book probes the ways in which businesses are redefining the customer journey. Topics include actor engagement beyond the brand-consumer dyad, the strategic use of AI in product development, the impact of marketer-generated content on consumer behavior, and the ethical imperatives of service ecosystems. Equally attentive to technological advances and human values, this collection examines how gamification, AR, and generative technologies are reshaping expectations, and why meaningful engagement must be ethical, inclusive, and human-centric.Each chapter offers actionable insights for academics, practitioners, and students exploring the new frontiers of customer engagement. This book equips scholars, strategists, and digital innovators with conceptual clarity and practical foresight needed to engage meaningfully with today’s empowered, tech-savvy consumers.
Customer Engagement in Theory and Practice: A Marketing Management Perspective
by Katarzyna ŻyminkowskaOffering a pragmatic understanding of customer engagement as an object of effective marketing management, this book takes an integrative approach and brings together different streams of marketing research, such as customer activism and value formation. The author explores the notion of customer engagement by analysing empirical data compiled from firms operating in the consumer goods and services sectors, as well as from the consumers themselves. An insightful read for scholars of consumer behaviour and customer relationship management, this book advances understanding of the drivers, components and effects (both positive and negative) of customer engagement and proposes a comprehensive framework for its management.
Customer Experience 3.0: High-Profit Strategies in the Age of Techno Service
by John A. GoodmanCustomer Experience 3.0 provides firsthand guidance on what works, what doesn't--and the revenue and word-of-mouth payoff of getting it right.Between smartphones, social media, mobile connectivity, and a plethora of other technological innovations changing the way we do almost everything these days, your customers are expecting you to be taking advantage of it all to enhance their customer service experience far beyond the meeting-the-minimum experiences of days past. Unfortunately, many companies are failing to take advantage of and properly manage these service-enhancing tools that now exist, and in return they deliver a series of frustrating, disjointed transactions that end up driving people away and into the pockets of businesses getting it right.Having managed more than 1,000 separate customer service studies, author John A. Goodman has created an innovative customer-experience framework and step-by-step roadmap that shows you how to:Design and deliver flawless services and products while setting honest customer expectationsCreate and implement an effective customer access strategyCapture and leverage the voice of the customer to set priorities and improve products, services and marketingUse CRM systems, cutting-edge metrics, and other tools to deliver customer satisfactionCompanies who get customer service right can regularly provide seamless experiences, seeming to know what customers want even before they know it themselves…while others end up staying generic, take stabs in the dark to try and fix the problem, and end up dropping the ball.Customer Experience 3.0 reveals how to delight customers using all the technological tools at their disposal.
Customer Experience Analytics: How Customers Can Better Guide Your Web and App Design Decisions
by Akin ArikanAn unprecedented guide to user experience (UX) analytics, this book closes a mission-critical skill gap and enables business professionals in a digital-first world to make smart, effective, and quick decisions based on experience analytics. Despite two decades of web metrics, customer experience has largely remained a black box. UX analytics tools help businesses to see themselves and their customers with a new lens, but decision-makers have had to depend on skilled analysts to interpret data from these tools, causing delays and confusion. No more: this book shows a wide range of professionals how to use UX analytics to improve the customer experience and increase revenue, and teaches the C-SUITE method for applying UX analytics to any digital optimization challenge. It provides 50 case studies and 30 cheat sheets to make this a daily reference, and includes ten mindmaps, one for each role discussed, from senior leaders to product managers to e-commerce specialists. Managers across industries will regularly consult this book to help them guide their teams, and entry- to mid-level professionals in marketing, e-commerce, sales, product management, and more will turn to these pages to improve their websites and apps.
Customer Experience Excellence: The Six Pillars of Growth
by Tim Knight David ConwayDiscover how the world's best brands create outstanding customer experience, engaged teams and market-beating growth with this practical guide, providing a model that will help any organization deliver effective and seamless customer engagement. Customer experience (CX) has been a phrase in business lexicon for over 30 years. Seen by many as the last battleground, where winners will gain competitive advantage and increased market share, there is not a company in the world that is not in some way focused on the quality of the experience they deliver.However, for many businesses, CX is neither a strategic discipline, consistently applied, nor is it a well-trodden path. It's not easy to deliver exceptional customer experience, again and again, and it becomes difficult to have a CX strategy that provides tangible and measurable results. Customer Experience Excellence provides a route map to CX success. Drawing on a vast body of research collated and curated by the global consulting group KPMG, this book shows how the world's most elite organizations have made excellence a habit, by creating authentic, human connections at scale. Whether dealing with external consumers or internal colleagues, learn how to become an enlightened and agile business and 'think customer' at every single touch point.
Customer Relationship Management Systems Handbook
by Duane E. SharpThis handbook provides a detailed description and analysis of the concepts, processes, and technologies used in the development and implementation of an effective customer relationship (CRM) strategy. It takes readers through the evolution of CRM- from its early beginning to today's sophisticated data warehouse-based systems. Illustrations enhance the textual presentation. Case studies provide insight and lessons-to-be-learned and describe the benefits of successful CRM implementations. The chapter on privacy issues covers the processes companies use to ensure the privacy of their customer data, the last chapter explores the benefits of a well-conceived CRM strategy.
Customer Relationship Management in Electronic Markets
by David Bejou Gopalkrishnan R IyerDiscover an important tool in the development of new marketing strategies for satisfying online customers! Edited by two experts in the fields of business and marketing, Customer Relationship Management in Electronic Markets is designed to help you build Internet relationships that lead to customer retention and long-term loyalty. With this book, you will be able to offer customers the benefits they seek in the virtual marketplace and serve their best interests. Examining Web sites, e-mail, data mining, and other technology, this valuable tool can help you attract and keep the customers who will be the most profitable for your business. Despite many predictions that electronic marketing would create high profits for lower costs, many businesses have been discouraged by low yields due to ineffectual methods of obtaining and maintaining customers. Customer Relationship Management in Electronic Markets provides multiple frameworks, strategies, and techniques around which to organize your company&’s electronic marketing plans. It shows you how to calculate trends, predict customer loss and gain, and prevent dissolution through analysis of the customer&’s ever-changing needs. This volume also utilizes examples of real successful companies that have used the Internet to the fullest extent, like Staples, Dell, and Amazon.com. Customer Relationship Management in Electronic Markets is an excellent resource for individuals engaged in any aspect of business relationships, from customer service managers, consultants and corporate trainers in marketing, to owners of major corporations, online businesses and entrepreneurs, and students in the field. Specifically, you will gain information on the following: business-to-business (B2B) and business-to-customer (B2C) exchanges-similarities, differences, and how the Internet has changed these relationships the prospects of the Internet for marketing and customer relationships-predictions, positive effects, and negative effects from its inception to today how to develop and maintain a loyal customer base via the Internet improving B2B exchanges and business buyer relationship management through seamless Internet integration how to create a Web site that satisfies loyal customers and draws in new customers Featuring several charts, tables, and graphs, this guide provides effective measures that you can institute to ensure your company&’s longevity. Customer Relationship Management in Electronic Markets will help you create marketing strategies that will successfully meet the needs of your customers and enhance your business reputation.
Customer Relationship Management in the Digital Age
by Jagdish N. Sheth G. Shainesh Varsha JainCustomer Relationship Management in the Digital Age charts the concepts, strategies, benefits and technologies of CRM in an evolving and increasingly digital business landscape.It empowers readers with the skills to use CRM to forge enduring customer connections, optimize experiences and drive loyalty across diverse industries and markets. Building upon existing literature, this guide offers a holistic approach that bridges theory and practice, making complex CRM concepts accessible to a wide audience. It integrates the latest technological advances, market trends and customer-centric initiatives, providing a comprehensive view of CRM’s role in an increasingly customer-driven era. Pedagogical features include case studies, practical strategies and real-world examples, as well as chapter summaries and discussion questions to guide the reader through the key learning points of each chapter.This helpful book enables readers to navigate the complexities of CRM implementation and customer-centric approaches and tailor strategies for B2B and B2C markets. It is particularly suitable for advanced undergraduate and postgraduate students of CRM, Sales Management, Relationship Marketing and Customer Experience Management, as well as reflective practitioners.Online instructor resources include a course manual, test bank and PowerPoint slides.
Customer Relationship Management: Concepts, Applications and Technologies
by Stan Maklan Francis Buttle Daniel D. PriorThis highly regarded textbook provides the definitive account of Customer Relationship Management (CRM) concepts, applications, and technologies, focusing on how companies can create and maintain mutually beneficial relationships with customers.Readers will gain a thorough understanding of the conceptual foundations of CRM, see CRM in practice through illustrative case examples and exercises, and understand how to organise customer data gathering, analysis, and presentation for decision making. The book achieves these outcomes by first considering strategic CRM before moving into operational CRM and, finally, onto analytical aspects of CRM. The fifth edition has been fully updated to include: A series of new case examples to illustrate CRM within various regional and industrial contexts, including those relevant to large, medium, and small enterprises A series of new exercises and discussion questions to help readers understand CRM concepts and to support pedagogical processes, particularly in higher education environments A greater emphasis on managerial applications of CRM through new content to help guide managers An updated account of new and emerging technologies relevant to CRM Expanded coverage of customer experience (CX), customer engagement (CE), and customer journey management (CJM) Customer Relationship Management is essential reading for advanced undergraduate and postgraduate students studying CRM, Sales Management, Customer Experience Management, and Relationship Marketing, as well as executives who oversee CRM functions. Online resources include an Instructor’s Manual, chapter-by-chapter PowerPoint slides, and a bank of exam questions.