- Table View
- List View
Project Objectives Management: Aligning Targets, Delivering Results, and Adapting to Changes
by Reitse van der WekkenManage supplier objectives effectively to align project and organizational success within your organization. This book introduces a dedicated method for suppliers to follow to ensure that all relevant targets and expectations are successfully meet. The method integrates a day-to-day high awareness, urgency, and focus on the management of all relevant objectives within the supplier’s project to provide maximum benefit for its organization. You'll learn that formal targets are routinely established at the start of a project and captured in a contract or project charter. Formal customer expectations, such as timelines, scope, and budget, have high focus and are often pitted against internal day-to-day challenges, such as cost increases and other unexpected changes. These challenges can seem even more daunting as a project progresses, especially when other stakeholders have expectations as well. When not managed properly, this can obstruct the focus of less urgent or informal objectives, such as employee development, process assets, and lessons learned, some of which provide a critical benefit for the supplier’s organization and its future. To combat this, you'll follow detailed instructions on how to handle such potential roadblocks and how to focus on achieving all relevant project objectives by applying the established method. Each chapter expands the dedicated method itself and provides insight into this philosophy. In the end you'll have all the necessary prerequisites for a successful implementation of these principles within your organization. What You Will Learn Define organizational objectives aligned with the organization’s purpose and values Prioritize and align project specific objectives with the organizational objectives Facilitate to achieve the project objectives Handle day-to-day challenges with managing the project objectives Balance customer and supplier targets and expectations Who This Book is For Project management professionals with various levels of skill and experience working at small-to-medium sized project suppliers, both for-profit and non-profit organisations.
Project Planning and Project Success: The 25% Solution (Best Practices In Portfolio, Program, And Project Management Ser. #15)
by Pedro SerradorProject planning is generally accepted as an important contributor to project success. However, is there research that affirms the positive impact of project planning and gives guidance on how much effort should be spent on planning? To answer these questions, this book looks at current literature and new research of this under-studied area of proj
Project Portfolio Management in Theory and Practice: Thirty Case Studies from around the World (Best Practices in Portfolio, Program, and Project Management #24)
by Jamal MoustafaevEvery CEO in the world, if questioned, will always complain that there are a lot of ideas to implement, but, unfortunately, insufficient resources to accomplish them. This book provides a solution to this dilemma by supplying techniques to assess the value of projects, prioritize projects, and decide which projects to implement and which to postpone. In addition, it describes various methods of balancing project portfolios and different strategic alignment models. The book provides thirty real-life project portfolio management case studies from pharmaceutical, product development, financial, energy, telecommunications, not-for-profit and professional services industries.
Project Reliability Engineering: Pro Skills for Next Level Maker Projects
by Eyal ShaharTurn your projects from a weekend hack to a long-living creation! Loosely drawing from the field known in large software companies as Site Reliability Engineering (SRE), this book distills from these disciplines and addresses issues that matter to makers: keeping projects up and running, and providing means to control, monitor, and troubleshoot them. Most examples use the Raspberry Pi, but the techniques discussed apply to other platforms as well. This book is all about breadth, and in the spirit of making, it visits different technologies as needed. However, the big goal in this book is to create a shift in the reader’s mindset, where weekend hacks are pushed to the next level and are treated as products to be deployed. In that regard, this book can be a stepping stone for hobbyist makers into developing a broader, professional skill set. First, the book describes techniques for creating web-browser based dashboards for projects. These allow project creators to monitor, control, and troubleshoot their projects in real-time. Project Reliability Engineering discusses various aspects of the process of creating a web dashboard, such as network communication protocols, multithreading, and web design, and data visualization. Later chapters cover configuration of the project and the machine it’s running on, and additional techniques for project monitoring and diagnosis. These include good logging practices; automatic log and metrics monitoring; and alerting via email and text messages; A mixture of advanced concepts forms the last chapter of the book, touching on topics such as usage of microservices in complex projects; debugging techniques for object-oriented projects; and fail-safing the project’s software and hardware. What You’ll Learn Monitor and control projects, keep them up and running, and troubleshoot them efficiently Get acquainted with available tools and libraries, and learn how to make your own tools Expand your knowledge in Python, JavaScript and Linux Develop deeper understanding of web technologies Design robust and complex systems Who This Book Is For Members of the maker community with some development skills.
Project Scope Management: A Practical Guide to Requirements for Engineering, Product, Construction, IT and Enterprise Projects (Best Practices in Portfolio, Program, and Project Management #16)
by Jamal MoustafaevIncomplete or missed requirements, omissions, ambiguous product features, lack of user involvement, unrealistic customer expectations, and the proverbial scope creep can result in cost overruns, missed deadlines, poor product quality, and can very well ruin a project. This book explains how to elicit, document, and manage requirements to control project scope creep. It also describes how to manage project stakeholders to minimize the risk of an ever-growing list of user requirements. The book examines five different projects and traces their development from a project scope management perspective.
Project Zero Trust: A Story about a Strategy for Aligning Security and the Business (Wiley Tax Library)
by George FinneyImplement Zero Trust initiatives efficiently and effectively In Project Zero Trust: A Story About a Strategy for Aligning Security and the Business, George Finney, Chief Security Officer at Southern Methodist University, delivers an insightful and practical discussion of Zero Trust implementation. Presented in the form of a fictional narrative involving a breach at a company, the book tracks the actions of the company's new IT Security Director. Readers will learn John Kindervag's 5-Step methodology for implementing Zero Trust, the four Zero Trust design principles, and how to limit the impact of a breach. They'll also find: Concrete strategies for aligning your security practices with the business Common myths and pitfalls when implementing Zero Trust and how to implement it in a cloud environment Strategies for preventing breaches that encourage efficiency and cost reduction in your company's security practices Project Zero Trust is an ideal resource for aspiring technology professionals, as well as experienced IT leaders, network engineers, system admins, and project managers who are interested in or expected to implement zero trust initiatives.
Project and Design Literacy as Cornerstones of Smart Education: Proceedings of the 4th International Conference on Smart Learning Ecosystems and Regional Development (Smart Innovation, Systems and Technologies #158)
by Matthias Rehm Jelle Saldien Stefania MancaThe book includes high-quality papers presented at the 4th International Conference on Smart Learning Ecosystems and Regional Development at Università Roma Tor Vergata, Italy, from 22 to 24 May, 2019. Providing insights into the relevance of smart learning ecosystems (schools, campuses, the workplace, informal learning contexts, etc.) for regional development and social innovation, it also discusses how citizens’ involvement with smart ecosystems can be increased and made more effective.
Project and Program Excellence: Motivational Leadership for Breakthrough Results
by Thomas PavelkoThis book provides insight, measures, and tools to manage a program or project to be first place amongst its competitors and similar efforts. Providing breakthrough insight by showing how to understand and use team member motivation, it gives leadership and team members the tools to be first place. It shows program and project managers how to motivate a team to perform better than its competitors while bringing great satisfaction and tailored growth to the team individuals. Highlights include: Selecting excellent task leads and determining the best team mix Fulfilling motivation needs during program and project execution Motivating high-tempo performance The very best performance of a program or project team occurs when the needs driving the fundamental motivations of team members are being met. This book explains how human motivation analysis substantiates the successful program and project, organizational and process elements that have been applied. By using the measure of providing promised deliverables within cost and schedule constraints and with managed risk, it describes team performance and explains the difference between a high-performance team and an average-performance one. It applies recent research of how motivation applies to programs and projects and how to accordingly organize a team. Beginning with an introduction of improvement concepts, this book reviews current program and project success statistics and then delves into how to reap the tremendous advantages of modern motivation-based organization leadership. It shows how to determine team member motivation and use it to assemble and execute a first-place program or project. Guidance includes showing how to assign the best mix of motivational types for each team and choosing leadership. Project and Program Excellence: Motivational Leadership for Breakthrough Results offers an organizational and leadership approach for highly successful development efforts.
Project and Program Turnaround (Best Practices in Portfolio, Program, and Project Management)
by Thomas PavelkoThe U.S. economy thrives on the development of new products, new systems, and new processes. Usually, these advances start as a flash of inspiration by highly creative individuals. It is complex and difficult to go from initial inspiration to a final product, process, or system. So it is not surprising that approximately one out of every four development programs fails. A development program or project in trouble is distinct from a program encountering typical development difficulties. Such a program or project can appear to be in free fall. This book identifies the essential fundamentals for executing a program or project turnaround effectively. These fundamentals include: Clearly identifying the next critical accomplishment needed for success Assigning responsibility for each program task to one person Capitalizing on colocation and face-to-face communication Recruiting problem solvers Wining commitment from team members Using team accomplishments to propel high team morale The guidance provided in this book is applicable to all program or project genres, including manufacturing, nonprofit work, education, medicine, investment management, and municipal management. Software has become a great part of both providing product functionality and assisting with managing product development. A special chapter devoted to software development dispels common misconceptions and provides guidance for turning around this special type of project or program. This book is a highly valuable source of insight for a wide range of readers, including management professionals, business students, and executive managers. Every member of a product or project development team will find its recommendations to be of high value.
Project to Product: How to Survive and Thrive in the Age of Digital Disruption with the Flow Framework
by Mik KerstenAs tech giants and startups disrupt every market, those who master large-scale software delivery will define the economic landscape of the 21st century, just as the masters of mass production defined the landscape in the 20th. Unfortunately, business and technology leaders are woefully ill-equipped to solve the problems posed by digital transformation. At the current rate of disruption, half of S&P 500 companies will be replaced in the next ten years. A new approach is needed.In Project to Product, Value Stream Network pioneer and technology business leader Dr. Mik Kersten introduces the Flow Framework—a new way of seeing, measuring, and managing software delivery. The Flow Framework will enable your company&’s evolution from project-oriented dinosaur to product-centric innovator that thrives in the Age of Software. If you&’re driving your organization&’s transformation at any level, this is the book for you.
Project. Program. Change
by Roland Gareis Lorenz GareisThis book gives managers an integrative approach to project, program, and change management. It describes the differences between change in projects versus programs with case studies in both areas and the different life cycles. While the project and change comprise much of the book, it is up to date with its emphasis on agile, scrum, and benefits. The book also describes methods to both initiate and manage a change and what must be done for success and business value.
Projections of Power: Framing News, Public Opinion, and U.S. Foreign Policy
by Robert M. EntmanTo succeed in foreign policy, U.S. presidents have to sell their versions or framings of political events to the news media and to the public. But since the end of the Cold War, journalists have increasingly resisted presidential views, even offering their own spin on events. What, then, determines whether the media will accept or reject the White House perspective? And what consequences does this new media environment have for policymaking and public opinion? To answer these questions, Robert M. Entman develops a powerful new model of how media framing works -- a model that allows him to explain why the media cheered American victories over small-time dictators in Grenada and Panama but barely noticed the success of far more difficult missions in Haiti and Kosovo. Discussing the practical implications of his model, Entman also suggests ways to more effectively encourage the exchange of ideas between the government and the media and between the media and the public. His book will be an essential guide for political scientists, students of the media, and anyone interested in the increasingly influential role of the media in foreign policy.
Projective Simulation in Action: Quantum-Mechanical Perspectives on the Problem of Agency (Synthese Library #507)
by Thomas Müller Hans J. BriegelThis open access monograph presents an in-depth study of the problem of how agency fits into the physical world. In particular, the authors focus on agency as a precondition of free will. They present a detailed and physically well motivated formal model to anchor their philosophical discussion. Coverage brings together perspectives from physics, computer science, and different branches of philosophy. The book describes the agency model of Projective Simulation, its physical realisability and its quantum extensions. It situates this model within the discussion of agency in philosophy and in Artificial Intelligence. In addition, the authors highlight the role of agency in Quantum Mechanics itself, recently stressed by the Bayesian-inspired interpretation of Quantum Mechanics, QBism. They provide a comprehensive exposition of Quantum Mechanics and a reflection on the embodied nature of agents. (Quantum) indeterminism turns out to be a key resource for Projective Simulation, and for agency in general. This establishes a novel connection between agency and phenomenology. Overall, the book provides a coherent picture of agents as persisting physical entities endowed with active capacities. Such an explanation does not necessarily settle the question of the actual empirical basis of our human agency. It does, however, show that a coherent notion of agency is possible within a modern scientific world-view.
Projects and Complexity: Theory, Methods, And Applications (Systems Innovation Book Ser.)
by Adedeji B. BadiruHelpful to those tasked with managing complex environments, Projects and Complexity introduces a new way of looking at projects and fostering the culture needed to achieve sustainable results. It brings together experts from the academic, military, and business worlds to explore project management in the context of complexity theory and organizatio
Projects as Socio-Technical Systems in Engineering Education
by Johan Meyer Zach Simpson Suné Von SolmsThis book presents the case for Project-Based Learning within Socio-Technical Systems in Engineering Education. The book highlights the importance of projects as Socio-Technical Systems as a means for supporting and enhancing international accreditation of engineering programs. Practical examples illustrate how Socio-Technical Systems are brought into the educational environment through Project-Based Learning. The book goes on to discusses the impact this may have on Engineering Education practice. <P><P>The work presented will enable engineering educators to develop curricula that can respond to societal needs, while also enhancing teaching and learning. It offers an approach to engineering education that centers on engaging scholars in projects that are located within socio-technical systems. University, government and industry leaders will gain from this book as it provides insight into strategic planning and partnership-building for Engineering Education. We hope this book will further foster deep scholarship of research to ready engineering faculties for engaging responsibly with their surrounding communities. <P><P>Features: <li>Offers applications of Project-Based Learning (PBL) in Engineering Education <li>Matches elements of Socio-Technical Systems in Higher Engineering Education, with the Exit Level Outcomes (ELOs) required by professional engineering bodies <li>Provides practical examples for the establishment of project environments within an academic faculty <li>Shows examples in the success of execution of projects involving engineering educators, researchers, program developers, government agencies and industry partners <li>Presents a framework to develop Project-Based Learning in Engineering Education that addresses Socio-Technical requirements and will enable engineering educators to collaboratively develop engineering curricula with industry that will respond to societal needs
Projects, Processes, Systems and Networks in the Digital Age: Proceedings of the 4th International Conference on the Leadership and Management of Projects in the Digital Age - ICLAMP 2025 (Lecture Notes in Networks and Systems #1548)
by Hatem Masri Kouzou Abdellah Nabil Elkadhi Saeed AldulaimiThis book offers a comprehensive and timely exploration of how artificial intelligence, digital transformation, emerging technologies, and innovative management practices are reshaping engineering and organizational landscapes in the digital era. Organized by Applied Science University (ASU), Bahrain and London South Bank University (LSBU), UK, the conference brought together international scholars and practitioners whose research reflects both academic rigor and practical relevance. Featuring a curated selection of peer-reviewed papers presented at ICLAMP 2025, this book examines how technology is being leveraged across sectors to solve real-world challenges, improve efficiency, and foster innovation through theoretical analyses and empirical case studies. Organized into six thematic sections, this book covers a wide spectrum of contemporary issues: · Artificial Intelligence: From ethical AI frameworks to digital twins and machine learning in healthcare. · Digital Transformation and Innovation in Engineering: Including mobile health applications, stock prediction, and educational tech. · Emerging Technologies and Innovation: Exploring blockchain integration, cyber risk, sustainability, and advanced decision support. · Leadership and Crisis Management: Investigating the strategic role of IoT, workforce evolution, and hybrid management models. · <str

Projektierung von Automatisierungsanlagen: Eine effektive und anschauliche Einführung
by Dieter Hofmann Thomas BindelIn diesem Lehrbuch werden die wesentlichen Schritte und Abläufe für die Planung und Durchführung von Automatisierungsprojekten im Bereich der Verfahrenstechnik beschrieben, wobei sowohl kontinuierliche als auch ereignisdiskrete Prozesse betrachtet werden. Ausgehend vom allgemeinen Aufbau einer Automatisierungsanlage werden dazu Erarbeitung und Inhalt der wesentlichen Projektunterlagen, Steuerungs- bzw. Regelungsentwurf sowie Grundlagen zur Projektierung der Hilfsenergieversorgung erläutert, wobei hinsichtlich des R&I-Fließschemas auch auf den Übergang von DIN 19227 zu DIN EN 62424 sowie hinsichtlich des EMSR-Stellenplans von DIN 40719 zu DIN EN 81346 eingegangen wird. Darstellungen zur Angebotserstellung und Kalkulation von Automatisierungsprojekten runden das Thema ab.

Projektmanagement für die Praxis: Ein Leitfaden und Werkzeugkasten für erfolgreiche Projekte
by Daud Alam Uwe GühlDieses Buch vermittelt in der 2. Auflage aktualisierte Inhalte und zusätzlich zum klassischen jetzt auch agiles Projektmanagement praxisnah und dient als Werkzeugkasten für Projekte. Dazu werden zunächst die wichtigsten Begriffe und Phasen des Projektmanagements normgerecht erläutert. Dann beschäftigt sich dieses Buch mit projektübergreifenden Querschnittsthemen und projektphasenspezifischen Inhalten, aufgeteilt in agiles und klassisches Projektmanagement. Tipps und Hinweise, Beispiele, Vorlagen und Checklisten aus der Projektpraxis im Automotive- und IT-Umfeld ergänzen die Inhalte.Für studierende Leser gibt es zusätzlich einen umfangreichen Fragenkatalog, um das erlernte Wissen zu festigen.Dies ermöglicht den Lesern einen guten und schnellen Zugang zum Thema Projektmanagement und hilft ihnen, ihre Projekte erfolgreich durchführen zu können.

Projektmanagement für die Praxis: Ein Leitfaden und Werkzeugkasten für erfolgreiche Projekte
by Daud Alam Uwe GühlDieses Buch vermittelt klassisches und agiles Projektmanagement praxisnah und dient als Werkzeugkasten für Projekte. Dazu werden zunächst die wichtigsten Begriffe und Phasen des Projektmanagements normgerecht erläutert. Dann beschäftigt sich dieses Buch mit projektübergreifenden Querschnittsthemen und projektphasenspezifischen Inhalten, aufgeteilt in agiles und klassisches Projektmanagement. Die 3. Auflage enthält nun ein einfaches konsistentes Fallbeispiel "Interkulturelle Hochzeit". Zudem wird Remote-Arbeit näher beleuchtet und ein innovativer integrativer Ansatz angelehnt an ein minimales Produkt bzw. an einen minimalen Prozess vorgestellt. Tipps und Hinweise, Beispiele, Vorlagen und Checklisten aus der Projektpraxis im Automotive- und IT-Umfeld ergänzen die Inhalte. Für studierende Leser gibt es zusätzlich einen umfangreichen Fragenkatalog, um das erlernte Wissen zu festigen. Dies ermöglicht den Lesern einen guten und schnellen Zugang zum Thema Projektmanagement und hilft ihnen, ihre Projekte erfolgreich durchführen zu können. Die Zielgruppe:Studierende (Master), Experten/Fachkräfte
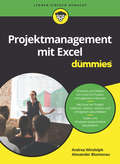
Projektmanagement mit Excel für Dummies (Für Dummies)
by Andrea Windolph Alexander BlumenauSie wollen Projekte effizienter umsetzen, aber nicht in spezielle Software investieren? Dieses Buch bietet Anleitungen und Tipps für die wohl am meisten verbreitete Software im Projektmanagement: Microsoft Excel. Sie erfahren, wie Sie Excel beim Initiieren, Planen, Überwachen und Abschluss eines Projekts unterstützt - und wo die Grenzen des Programms liegen. Risikoanalyse, Gantt-Chart, Prognoserechnungen: Lernen Sie typische Projektmanagement-Methoden kennen und erfahren Sie insbesondere, wie Sie Informationen und Daten ansprechend visualisieren und vor Auftraggeber und Team präsentieren.
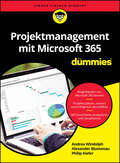
Projektmanagement mit Microsoft 365 für Dummies (Für Dummies)
by Andrea Windolph Alexander Blumenau Philip KieferSchritt für Schritt zum erfolgreichen Projekt In diesem Buch erfahren Sie, wie die Funktionen von Excel und weiteren Microsoft-365-Programmen Sie beim Initiieren, Planen und Überwachen von Projekten unterstützen. Von der Risikoanalyse bis zu Prognoserechnungen: Lernen Sie typische Projektmanagement-Methoden kennen und erfahren Sie insbesondere, wie Sie Informationen und Daten mit Excel aufbereiten, ansprechend visualisieren und anschließend vor Auftraggeber und Team präsentieren. Auch die Verwaltung von Aufgaben sowie die digitale Zusammenarbeit mithilfe von OneDrive und Microsoft Teams kommen nicht zu kurz. Sie erfahren Wie Sie Termine, Ressourcen und Kosten planen Wie Sie Fortschritte messen, Berichte erstellen und den Projektabschluss gestalten Welche Microsoft-365-Tools die Zusammenarbeit bei Projekten erleichtern Wie Sie Daten ansprechend visualisieren
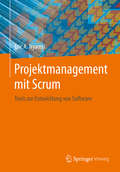
Projektmanagement mit Scrum: Tools zur Entwicklung von Software
by Eric A. NyamsiDas Buch stellt die Entwicklung der Automotive-Anwendungen auf Basis vom Open Source Java XDEV4 Framework mit Datenbank MySQL, Server Tomcat und Scrum-Vorgehensmodell dar, welches das Scrum-Projektmanagement bezüglich der Realisierung der Automotive-Anforderungen ermöglicht. Während des Verlaufs des Projektmanagements mit Scrum wird der Entwurf des Projekts auf das User-Story-Modell fokussiert. Das Projekt stellt die Drag-Drop-Entwicklung mit dem Open Source Java RapidClipse bezüglich der Webanwendung dar. Java-Oberflächen werden mit dem Java Framework RapidClipse erstellt. Das Buch gibt einen Überblick über das Konzept „Vom Modellieren zum Programmieren“ mit dem Eclipse Modeling Framework (EMF).
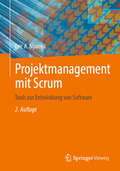
Projektmanagement mit Scrum: Tools zur Entwicklung von Software
by Eric A. NyamsiDas Buch stellt die Entwicklung der Automotive-Anwendungen auf Basis von Open Source Java XDEV5/6 Framework, Eclipse Java, Jakarta EE (Version 10) mit Datenbank MySQL, Server Tomcat, Glassfish, Wildfly und Scrum-Vorgehensmodell dar, welches das Scrum-Projektmanagement bezüglich der Realisierung der Automotive-Anforderungen ermöglicht. Während des Verlaufs des Projektmanagements mit Scrum wird der Entwurf des Projekts auf das User-Story-Modell fokussiert. Das Projekt stellt die Web-Entwicklung mit den Open Sources RapidClipse und Jakarta Enterprise Edition Eclipse bezüglich der Webanwendung dar. Java-Oberflächen werden mit dem Java Enterpise Framework Jakarta EE auf Basis von Faces 4.1.0 erstellt. Das Buch gibt einen Überblick über das Konzept „Vom Modellieren zum Programmieren“ mit dem Eclipse Modeling Framework (EMF).
Projektowanie interfejsów. Sprawdzone wzorce projektowe
by Jenifer TidwellNajwa?niejsze jest pierwsze wra?enie!Mimo istnienia ogromnej ilo?ci narz?dzi do tworzenia interfejsów u?ytkownika projektowanie dobrych interfejsów aplikacji wci?? nie jest ?atwe. Ta bestsellerowa ksi??ka jest jednym z niewielu wiarygodnych ?róde?, które pomog? Ci przej?? przez istny labirynt wariantów projektowych. "Projektowanie interfejsów" przedstawia najlepsze praktyki i gotowe do wdro?enia pomys?y w postaci wzorców UI oraz dostarcza rozwi?za? powszechnych problemów w dziedzinie projektowania. Rozwi?zania te mo?esz ?atwo dostosowa? do sytuacji, w jakiej si? znajdujesz.W niniejszym zaktualizowanym wydaniu znajdziesz wzorce do wykorzystania zarówno w aplikacjach mobilnych i mediach spo?eczno?ciowych, jak i w aplikacjach internetowych czy programach komputerowych. Ka?dy wzorzec zilustrowany jest przyk?adowymi projektami oraz opatrzony praktycznymi poradami, z których mo?esz natychmiast skorzysta?. Do?wiadczeni projektanci mog? u?ywa? tego przewodnika jako ?ród?a pomys?ów, za? pocz?tkuj?cy mog? go potraktowa? jak map? w drodze przez ?wiat projektowania interfejsów i interakcji.Twórz porywaj?ce i praktyczne interfejsy - pewnie, a nie po omackuPoznaj trudne do interpretacji koncepcje projektowania: afordancje, hierarchi? wizualn?, odleg?o?? nawigacyjn? oraz wykorzystanie kolorówZapoznaj si? z rekomendacjami poszczególnych wzorców UI, a tak?e z wzorcami zast?pczymi i poradami, kiedy pewnych wzorców nie nale?y u?ywa???cz i zestawiaj wzorce interfejsu wed?ug upodoba?Dopie?? wygl?d i dzia?anie interfejsów dzi?ki wykorzystaniu zasad projektowania graficznego oraz wzorcówU?ytkownicy wybieraj? atrakcyjne i praktyczne interfejsy!

Projektowanie nawigacji strony WWW. Optymalizacja funkcjonalno?ci witryny
by James KalbachSekrety sukcesu witryn WWWW jaki sposób u?ytkownicy przegl?daj? witryny WWW?Jak wykorzysta? ró?ne typy mechanizmów nawigacyjnych?W jaki sposób dobra? kolorystyk? i liternictwo elementów nawigacyjnych?Dynamiczny rozwój internetu i technologii sieciowych sprawi?, ?e korzystanie z sieci sta?o si? równie powszechne jak ogl?danie telewizji i czytanie gazet. Poprzez witryny WWW zdobywamy niezb?dne informacje, zamawiamy towary, p?acimy rachunki i kontaktujemy si? z przyjació?mi. Co sprawia, ?e w?ród setek tysi?cy serwisów internetowych posiadaj?cych podobne mo?liwo?ci jedne ciesz? si? popularno?ci? u?ytkowników, a inne nie? Na pewno na atrakcyjno?? strony WWW wp?ywa grafika i tre??, ale przede wszystkim jej funkcjonalno??. Natomiast o wygodzie korzystania ze niej decyduje nawigacja, czyli sposób, w jaki uzyskujemy potrzebne informacje, przechodzimy pomi?dzy stronami i wybieramy interesuj?ce tematy. Wspó?czesne techniki tworzenia witryn WWW - Flash, AJAX i inne - pozwalaj? na kreowanie niezwykle atrakcyjnych interfejsów u?ytkownika, ale kluczem do sukcesu jest w?a?nie odpowiedni projekt struktury nawigacyjnej. Ksi??ka "Projektowanie nawigacji strony WWW. Optymalizacja ergonomii witryny " to podr?cznik, który u?atwi poznanie i zastosowanie w praktyce zasad projektowania ergonomicznych i efektownych mechanizmów nawigacyjnych na stronach WWW. Czytaj?c go, dowiesz si?, czego oczekuj? u?ytkownicy stron WWW, jakie schematy nawigacji stosuje si? najcz??ciej i jak dobra? typ nawigacji do przeznaczenia i tre?ci witryny. Nauczysz si? analizowa? cele witryny, tworzy? prototypy i scenariusze nawigacji, okre?la? ?cie?ki nawigacji i budowa? elementy menu. Przeczytasz tak?e o projektowaniu interfejsów u?ytkownika dla aplikacji sieciowych oraz ??czeniu mechanizmów nawigacyjnych z wyszukiwawczymi. Podstawowe cele mechanizmów nawigacji w witrynie WWWTeoretyczne modele wyszukiwaniaTypy mechanizmów nawigacyjnychMetody analizy i oceny projektu nawigacjiTworzenie prototypów i ?cie?ek nawigacjiDobór kolorów, czcionek i stylów dla elementów nawigacyjnychMechanizmy wyszukiwawczeZnakowanie tre?ci w portalach spo?eczno?ciowychInterfejsy u?ytkownika w aplikacjach internetowychTwórz przejrzyste i wygodne mechanizmy nawigacyjne.