- Table View
- List View
R by Example (Use R!)
by Jim Albert Maria RizzoNow in its second edition, R by Example is an example-based introduction to the statistical computing environment that does not assume any previous familiarity with R or other software packages. R functions are presented in the context of interesting applications with real data. The purpose of this book is to illustrate a range of statistical and probability computations using R for people who are learning, teaching, or using statistics. Specifically, it is written for users who have covered at least the equivalent of (or are currently studying) undergraduate level calculus-based courses in statistics. These users are learning or applying exploratory and inferential methods for analyzing data, and this book is intended to be a useful resource for learning how to implement these procedures in R. The new edition includes expanded coverage of ggplot2 graphics, as well as new chapters on importing data and multivariate data methods.
R for Basic Biostatistics in Medical Research
by Anand Srinivasan Archana Mishra Praveen Kumar-MThe scientific community at the global level is fast becoming aware of the rising use of open-source tools such as R and Python for data analysis. Unfortunately, in spite of the awareness, the conversion of the intrigue to the practical knowledge in utilization of the open-source tools for routine day-to-day data analysis is seriously lacking both among physicians and medical scientists. This book enables physician-scientists to understand the complexity of explaining a programming/ data-analytic language to a healthcare professional and medical scientist. It simplifies and explains how R can be used in medical projects and routine office works. It also talks about the methodologies to convert the knowledge to practice. The book starts with the introduction to the structure of R programming language in the initial chapters, followed with explanations of utilizing R in the basics of data analysis like data importing and exporting, operations on a data frame, parametric and non-parametric tests, regression, sample size calculation, survival analysis, receiver operator characteristic analysis (ROC) and techniques of randomization. Each chapter provides a brief introduction to the involved statistics, for example, dataset, working codes, and a section explaining the codes. In addition to it, a chapter has been dedicated to describing the ways to generate plots using R. This book primarily targets health care professionals and medical/life-science researchers in general.
R for Business Analytics
by A OhriR for Business Analytics looks at some of the most common tasks performed by business analysts and helps the user navigate the wealth of information in R and its 4000 packages. With this information the reader can select the packages that can help process the analytical tasks with minimum effort and maximum usefulness. The use of Graphical User Interfaces (GUI) is emphasized in this book to further cut down and bend the famous learning curve in learning R. This book is aimed to help you kick-start with analytics including chapters on data visualization, code examples on web analytics and social media analytics, clustering, regression models, text mining, data mining models and forecasting. The book tries to expose the reader to a breadth of business analytics topics without burying the user in needless depth. The included references and links allow the reader to pursue business analytics topics. This book is aimed at business analysts with basic programming skills for using R for Business Analytics. Note the scope of the book is neither statistical theory nor graduate level research for statistics, but rather it is for business analytics practitioners. Business analytics (BA) refers to the field of exploration and investigation of data generated by businesses. Business Intelligence (BI) is the seamless dissemination of information through the organization, which primarily involves business metrics both past and current for the use of decision support in businesses. Data Mining (DM) is the process of discovering new patterns from large data using algorithms and statistical methods. To differentiate between the three, BI is mostly current reports, BA is models to predict and strategize and DM matches patterns in big data. The R statistical software is the fastest growing analytics platform in the world, and is established in both academia and corporations for robustness, reliability and accuracy. The book utilizes Albert Einstein's famous remarks on making things as simple as possible, but no simpler. This book will blow the last remaining doubts in your mind about using R in your business environment. Even non-technical users will enjoy the easy-to-use examples. The interviews with creators and corporate users of R make the book very readable. The author firmly believes Isaac Asimov was a better writer in spreading science than any textbook or journal author.
R for Cloud Computing
by A OhriR for Cloud Computing looks at some of the tasks performed by business analysts on the desktop (PC era) and helps the user navigate the wealth of information in R and its 4000 packages as well as transition the same analytics using the cloud. With this information the reader can select both cloud vendors and the sometimes confusing cloud ecosystem as well as the R packages that can help process the analytical tasks with minimum effort, cost and maximum usefulness and customization. The use of Graphical User Interfaces (GUI) and Step by Step screenshot tutorials is emphasized in this book to lessen the famous learning curve in learning R and some of the needless confusion created in cloud computing that hinders its widespread adoption. This will help you kick-start analytics on the cloud including chapters on both cloud computing, R, common tasks performed in analytics including the current focus and scrutiny of Big Data Analytics, setting up and navigating cloud providers. Readers are exposed to a breadth of cloud computing choices and analytics topics without being buried in needless depth. The included references and links allow the reader to pursue business analytics on the cloud easily. It is aimed at practical analytics and is easy to transition from existing analytical set up to the cloud on an open source system based primarily on R. This book is aimed at industry practitioners with basic programming skills and students who want to enter analytics as a profession. Note the scope of the book is neither statistical theory nor graduate level research for statistics, but rather it is for business analytics practitioners. It will also help researchers and academics but at a practical rather than conceptual level. The R statistical software is the fastest growing analytics platform in the world, and is established in both academia and corporations for robustness, reliability and accuracy. The cloud computing paradigm is firmly established as the next generation of computing from microprocessors to desktop PCs to cloud.
R for Data Science
by Dan ToomeyIf you are a data analyst who has a firm grip on some advanced data analysis techniques and wants to learn how to leverage the features of R, this is the book for you. You should have some basic knowledge of the R language and should know about some data science topics.
R for Data Science Cookbook
by Chiu Yu-WeiOver 100 hands-on recipes to effectively solve real-world data problems using the most popular R packages and techniques About This Book * Gain insight into how data scientists collect, process, analyze, and visualize data using some of the most popular R packages * Understand how to apply useful data analysis techniques in R for real-world applications * An easy-to-follow guide to make the life of data scientist easier with the problems faced while performing data analysis Who This Book Is For This book is for those who are already familiar with the basic operation of R, but want to learn how to efficiently and effectively analyze real-world data problems using practical R packages. What You Will Learn * Get to know the functional characteristics of R language * Extract, transform, and load data from heterogeneous sources * Understand how easily R can confront probability and statistics problems * Get simple R instructions to quickly organize and manipulate large datasets * Create professional data visualizations and interactive reports * Predict user purchase behavior by adopting a classification approach * Implement data mining techniques to discover items that are frequently purchased together * Group similar text documents by using various clustering methods In Detail This cookbook offers a range of data analysis samples in simple and straightforward R code, providing step-by-step resources and time-saving methods to help you solve data problems efficiently. The first section deals with how to create R functions to avoid the unnecessary duplication of code. You will learn how to prepare, process, and perform sophisticated ETL for heterogeneous data sources with R packages. An example of data manipulation is provided, illustrating how to use the "dplyr" and "data.table" packages to efficiently process larger data structures. We also focus on "ggplot2" and show you how to create advanced figures for data exploration. In addition, you will learn how to build an interactive report using the "ggvis" package. Later chapters offer insight into time series analysis on financial data, while there is detailed information on the hot topic of machine learning, including data classification, regression, clustering, association rule mining, and dimension reduction. By the end of this book, you will understand how to resolve issues and will be able to comfortably offer solutions to problems encountered while performing data analysis. Style and approach This easy-to-follow guide is full of hands-on examples of data analysis with R. Each topic is fully explained beginning with the core concept, followed by step-by-step practical examples, and concluding with detailed explanations of each concept used.
R for Data Science: Import, Tidy, Transform, Visualize, and Model Data
by Garrett Grolemund Hadley WickhamLearn how to use R to turn raw data into insight, knowledge, and understanding. This book introduces you to R, RStudio, and the tidyverse, a collection of R packages designed to work together to make data science fast, fluent, and fun. Suitable for readers with no previous programming experience, R for Data Science is designed to get you doing data science as quickly as possible.Authors Hadley Wickham and Garrett Grolemund guide you through the steps of importing, wrangling, exploring, and modeling your data and communicating the results. You’ll get a complete, big-picture understanding of the data science cycle, along with basic tools you need to manage the details. Each section of the book is paired with exercises to help you practice what you’ve learned along the way.You’ll learn how to:Wrangle—transform your datasets into a form convenient for analysisProgram—learn powerful R tools for solving data problems with greater clarity and easeExplore—examine your data, generate hypotheses, and quickly test themModel—provide a low-dimensional summary that captures true "signals" in your datasetCommunicate—learn R Markdown for integrating prose, code, and results
R for Data Science: Import, Tidy, Transform, Visualize, and Model Data
by Garrett Grolemund Hadley Wickham Mine Çetinkaya-RundelUse R to turn data into insight, knowledge, and understanding. With this practical book, aspiring data scientists will learn how to do data science with R and RStudio, along with the tidyverse—a collection of R packages designed to work together to make data science fast, fluent, and fun. Even if you have no programming experience, this updated edition will have you doing data science quickly.You'll learn how to import, transform, and visualize your data and communicate the results. And you'll get a complete, big-picture understanding of the data science cycle and the basic tools you need to manage the details. Updated for the latest tidyverse features and best practices, new chapters show you how to get data from spreadsheets, databases, and websites. Exercises help you practice what you've learned along the way.You'll understand how to:Visualize: Create plots for data exploration and communication of resultsTransform: Discover variable types and the tools to work with themImport: Get data into R and in a form convenient for analysisProgram: Learn R tools for solving data problems with greater clarity and easeCommunicate: Integrate prose, code, and results with Quarto
R for Health Data Science
by Ewen Harrison Riinu PiusIn this age of information, the manipulation, analysis, and interpretation of data have become a fundamental part of professional life; nowhere more so than in the delivery of healthcare. From the understanding of disease and the development of new treatments, to the diagnosis and management of individual patients, the use of data and technology is now an integral part of the business of healthcare. Those working in healthcare interact daily with data, often without realising it. The conversion of this avalanche of information to useful knowledge is essential for high-quality patient care. R for Health Data Science includes everything a healthcare professional needs to go from R novice to R guru. By the end of this book, you will be taking a sophisticated approach to health data science with beautiful visualisations, elegant tables, and nuanced analyses. Features Provides an introduction to the fundamentals of R for healthcare professionals Highlights the most popular statistical approaches to health data science Written to be as accessible as possible with minimal mathematics Emphasises the importance of truly understanding the underlying data through the use of plots Includes numerous examples that can be adapted for your own data Helps you create publishable documents and collaborate across teams With this book, you are in safe hands – Prof. Harrison is a clinician and Dr. Pius is a data scientist, bringing 25 years’ combined experience of using R at the coal face. This content has been taught to hundreds of individuals from a variety of backgrounds, from rank beginners to experts moving to R from other platforms.
R for Non-Programmers
by Daniel DauberUnlock the Power of Data Analysis with RWhether you are a researcher, student, or professional new to programming, this book provides a step-by-step guide to mastering R for quantitative and mixed-methods analysis. Designed for those who still need to gain program- ming experience or wish to learn a new one, it demystifies data analysis, helping you tackle challenges from data wrangling to statistical modelling. Packed with practical examples, engaging explanations, and real-world applications, this book equips you with the tools to analyse data confidently, identify trends, and uncover meaningful insights.Transform Your Approach to ResearchThrough clear instructions and hands-on exercises, you will learn to prepare datasets, explore patterns with descriptive statistics, and create impactful visualisations. You will also gain confidence in performing statistical tests such as comparing groups and building predictive models using regression techniques. This book provides strategies and tools to streamline your workflow, whether handling large datasets, managing missing data, or conducting mixed-methods research.Each chapter builds your expertise incrementally, supported by accessible examples and interactive online training. The accompanying training modules, available through the book’s companion package, offer engaging exercises and extended examples to reinforce learning. These features enable you to practise skills and retain knowledge more effectively.This book, which strongly focuses on reproducible research, is an indispensable guide for anyone looking to enhance their analytical toolkit and unlock R’s full potential for data analysis and statistical modelling.
R for Programmers: Advanced Techniques
by Dan ZhangThis book discusses advanced topics such as R core programing, object oriented R programing, parallel computing with R, and spatial data types. The author leads readers to merge mature and effective methdologies in traditional programing to R programing. It shows how to interface R with C, Java, and other popular programing laguages and platforms.
R for Programmers: Mastering the Tools
by Dan ZhangUnlike other books about R, written from the perspective of statistics, this book is written from the perspective of programmers, providing a channel for programmers with expertise in other programming languages to quickly understand R. The contents are divided into four parts: the basics of R, the server of R, databases and big data, and the appendices, which introduce the installation of Java, various databases, and Hadoop. Because this is a reference book, there is no special sequence for reading all the chapters. Anyone new to the subject who wishes to master R comprehensively can simply follow the chapters in sequence.
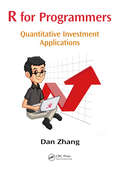
R for Programmers: Quantitative Investment Applications
by Dan ZhangAfter the fundamental volume and the advanced technique volume, this volume focuses on R applications in the quantitative investment area. Quantitative investment has been hot for some years, and there are more and more startups working on it, combined with many other internet communities and business models. R is widely used in this area, and can be a very powerful tool. The author introduces R applications with cases from his own startup, covering topics like portfolio optimization and risk management.
R for SAS and SPSS Users
by Robert A. MuenchenThis book introduces R using SAS and SPSS terms. It demonstrates which of the add-on packages are most like SAS and SPSS and compares them to R's built-in functions. It compares and contrasts the differing approaches of all three packages.
R for Stata Users
by Robert A. Muenchen Joseph M. HilbeStata is the most flexible and extensible data analysis package available from a commercial vendor. R is a similarly flexible free and open source package for data analysis, with over 3,000 add-on packages available. This book shows you how to extend the power of Stata through the use of R. It introduces R using Stata terminology with which you are already familiar. It steps through more than 30 programs written in both languages, comparing and contrasting the two packages' different approaches. When finished, you will be able to use R in conjunction with Stata, or separately, to import data, manage and transform it, create publication quality graphics, and perform basic statistical analyses. A glossary defines over 50 R terms using Stata jargon and again using more formal R terminology. The table of contents and index allow you to find equivalent R functions by looking up Stata commands and vice versa. The example programs and practice datasets for both R and Stata are available for download.
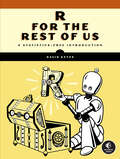
R for the Rest of Us: A Statistics-Free Introduction
by David KeyesLearn how to use R for everything from workload automation and creating online reports, to interpreting data, map making, and more.Written by the founder of a very popular online training platform for the R programming language!The R programming language is a remarkably powerful tool for data analysis and visualization, but its steep learning curve can be intimidating for some. If you just want to automate repetitive tasks or visualize your data, without the need for complex math, R for the Rest of Us is for you.Inside you&’ll find a crash course in R, a quick tour of the RStudio programming environment, and a collection of real-world applications that you can put to use right away. You&’ll learn how to create informative visualizations, streamline report generation, and develop interactive websites—whether you&’re a seasoned R user or have never written a line of R code.You&’ll also learn how to:• Manipulate, clean, and parse your data with tidyverse packages like dplyr and tidyr to make data science operations more user-friendly• Create stunning and customized plots, graphs, and charts with ggplot2 to effectively communicate your data insights• Import geospatial data and write code to produce visually appealing maps automatically• Generate dynamic reports, presentations, and interactive websites with R Markdown and Quarto that seamlessly integrate code, text, and graphics• Develop custom functions and packages tailored to your specific needs, allowing you to extend R&’s functionality and automate complex tasksUnlock a treasure trove of techniques to transform the way you work. With R for the Rest of Us, you&’ll discover the power of R to get stuff done. No advanced statistics degree required.
R für Dummies (Für Dummies)
by Joris Meys Andrie de VriesWollen Sie auch die umfangreichen Möglichkeiten von R nutzen, um Ihre Daten zu analysieren, sind sich aber nicht sicher, ob Sie mit der Programmiersprache wirklich zurechtkommen? Keine Sorge - dieses Buch zeigt Ihnen, wie es geht - selbst wenn Sie keine Vorkenntnisse in der Programmierung oder Statistik haben. Andrie de Vries und Joris Meys zeigen Ihnen Schritt für Schritt und anhand zahlreicher Beispiele, was Sie alles mit R machen können und vor allem wie Sie es machen können. Von den Grundlagen und den ersten Skripten bis hin zu komplexen statistischen Analysen und der Erstellung aussagekräftiger Grafiken. Auch fortgeschrittenere Nutzer finden in diesem Buch viele Tipps und Tricks, die Ihnen die Datenauswertung erleichtern.
R in Action, Third Edition: Data analysis and graphics with R and Tidyverse
by Robert I. KabacoffR is the most powerful tool you can use for statistical analysis. This definitive guide smooths R&’s steep learning curve with practical solutions and real-world applications for commercial environments.In R in Action, Third Edition you will learn how to: Set up and install R and RStudio Clean, manage, and analyze data with R Use the ggplot2 package for graphs and visualizations Solve data management problems using R functions Fit and interpret regression models Test hypotheses and estimate confidence Simplify complex multivariate data with principal components and exploratory factor analysis Make predictions using time series forecasting Create dynamic reports and stunning visualizations Techniques for debugging programs and creating packages R in Action, Third Edition makes learning R quick and easy. That&’s why thousands of data scientists have chosen this guide to help them master the powerful language. Far from being a dry academic tome, every example you&’ll encounter in this book is relevant to scientific and business developers, and helps you solve common data challenges. R expert Rob Kabacoff takes you on a crash course in statistics, from dealing with messy and incomplete data to creating stunning visualizations. This revised and expanded third edition contains fresh coverage of the new tidyverse approach to data analysis and R&’s state-of-the-art graphing capabilities with the ggplot2 package. About the technology Used daily by data scientists, researchers, and quants of all types, R is the gold standard for statistical data analysis. This free and open source language includes packages for everything from advanced data visualization to deep learning. Instantly comfortable for mathematically minded users, R easily handles practical problems without forcing you to think like a software engineer. About the book R in Action, Third Edition teaches you how to do statistical analysis and data visualization using R and its popular tidyverse packages. In it, you&’ll investigate real-world data challenges, including forecasting, data mining, and dynamic report writing. This revised third edition adds new coverage for graphing with ggplot2, along with examples for machine learning topics like clustering, classification, and time series analysis. What's inside Clean, manage, and analyze data Use the ggplot2 package for graphs and visualizations Techniques for debugging programs and creating packages A complete learning resource for R and tidyverse About the reader Requires basic math and statistics. No prior experience with R needed. About the author Dr. Robert I Kabacoff is a professor of quantitative analytics at Wesleyan University and a seasoned data scientist with more than 20 years of experience. Table of Contents PART 1 GETTING STARTED 1 Introduction to R 2 Creating a dataset 3 Basic data management 4 Getting started with graphs 5 Advanced data management PART 2 BASIC METHODS 6 Basic graphs 7 Basic statistics PART 3 INTERMEDIATE METHODS 8 Regression 9 Analysis of variance 10 Power analysis 11 Intermediate graphs 12 Resampling statistics and bootstrapping PART 4 ADVANCED METHODS 13 Generalized linear models 14 Principal components and factor analysis 15 Time series 16 Cluster analysis 17 Classification 18 Advanced methods for missing data PART 5 EXPANDING YOUR SKILLS 19 Advanced graphs 20 Advanced programming 21 Creating dynamic reports 22 Creating a package
R in Action: Data analysis and graphics with R
by Robert I. KabacoffSummaryR in Action, Second Edition presents both the R language and the examples that make it so useful for business developers. Focusing on practical solutions, the book offers a crash course in statistics and covers elegant methods for dealing with messy and incomplete data that are difficult to analyze using traditional methods. You'll also master R's extensive graphical capabilities for exploring and presenting data visually. And this expanded second edition includes new chapters on time series analysis, cluster analysis, and classification methodologies, including decision trees, random forests, and support vector machines.Purchase of the print book includes a free eBook in PDF, Kindle, and ePub formats from Manning Publications.About the TechnologyBusiness pros and researchers thrive on data, and R speaks the language of data analysis. R is a powerful programming language for statistical computing. Unlike general-purpose tools, R provides thousands of modules for solving just about any data-crunching or presentation challenge you're likely to face. R runs on all important platforms and is used by thousands of major corporations and institutions worldwide.About the BookR in Action, Second Edition teaches you how to use the R language by presenting examples relevant to scientific, technical, and business developers. Focusing on practical solutions, the book offers a crash course in statistics, including elegant methods for dealing with messy and incomplete data. You'll also master R's extensive graphical capabilities for exploring and presenting data visually. And this expanded second edition includes new chapters on forecasting, data mining, and dynamic report writing.What's InsideComplete R language tutorialUsing R to manage, analyze, and visualize dataTechniques for debugging programs and creating packagesOOP in ROver 160 graphsAbout the AuthorDr. Rob Kabacoff is a seasoned researcher and teacher who specializes in data analysis. He also maintains the popular Quick-R website at statmethods.net.Table of ContentsPART 1 GETTING STARTEDIntroduction to RCreating a datasetGetting started with graphsBasic data managementAdvanced data managementPART 2 BASIC METHODSBasic graphsBasic statisticsPART 3 INTERMEDIATE METHODSRegressionAnalysis of variancePower analysisIntermediate graphsResampling statistics and bootstrappingPART 4 ADVANCED METHODSGeneralized linear modelsPrincipal components and factor analysisTime seriesCluster analysisClassificationAdvanced methods for missing dataPART 5 EXPANDING YOUR SKILLSAdvanced graphics with ggplot2Advanced programmingCreating a packageCreating dynamic reportsAdvanced graphics with the lattice package available online only from manning.com/kabacoff2
R in Projekten anwenden für Dummies (Für Dummies)
by Joseph SchmullerDieses Buch bietet einen einzigartigen Learning-by-Doing-Ansatz. Sie werden Ihre R-Fähigkeiten erweitern und vertiefen, indem Sie eine Vielzahl von Beispielprojekten aus der Praxis nachvollziehen. Erlernen Sie die Grundlagen von R und RStudio sowie Möglichkeiten der Datenreduktion, des Mapping und der Bildverarbeitung. Dabei kommen Werkzeuge zum Einsatz, die Daten grafisch auswerten, die Analyse interaktiv machen oder die maschinelles Lernen einsetzen. Und auf dem Weg dahin können Sie sogar Ihr Statistikwissen noch erweitern. Warum sollten Sie das Rad neu erfinden, wenn es schon fertige R-Pakete gibt, die Ihre Bedürfnisse bedienen? Hier lernen Sie sie kennen.
R in a Nutshell: A Desktop Quick Reference
by Joseph AdlerIf you’re considering R for statistical computing and data visualization, this book provides a quick and practical guide to just about everything you can do with the open source R language and software environment. You’ll learn how to write R functions and use R packages to help you prepare, visualize, and analyze data. Author Joseph Adler illustrates each process with a wealth of examples from medicine, business, and sports.Updated for R 2.14 and 2.15, this second edition includes new and expanded chapters on R performance, the ggplot2 data visualization package, and parallel R computing with Hadoop.Get started quickly with an R tutorial and hundreds of examplesExplore R syntax, objects, and other language detailsFind thousands of user-contributed R packages online, including BioconductorLearn how to use R to prepare data for analysisVisualize your data with R’s graphics, lattice, and ggplot2 packagesUse R to calculate statistical fests, fit models, and compute probability distributionsSpeed up intensive computations by writing parallel R programs for HadoopGet a complete desktop reference to R
R kompakt: Der schnelle Einstieg in die Datenanalyse
by Daniel WollschlägerDieses Buch bietet eine kompakte Einführung in die Datenauswertung mit der freien Statistikumgebung R. Ziel ist es dabei, einen Überblick über die Funktionalität von R zu liefern und einen schnellen Einstieg in die deskriptive Datenauswertung sowie in die Umsetzung der wichtigsten statistischen Tests zu ermöglichen. Zudem deckt das Buch die vielfältigen Möglichkeiten ab, Diagramme zu erstellen, Daten mit anderen Programmen auszutauschen und R durch Zusatzpakete zu erweitern. Das Buch ist damit für Leser geeignet, die R kennenlernen und rasch in konkreten Aufgabenstellungen einsetzen möchten.Für die 3. Auflage wurde das Buch grundlegend überarbeitet und auf Neuerungen der R Version 4.1.0 sowie der aktuellen Landschaft der Zusatzpakete abgestimmt. Mit einer stärkeren Ausrichtung auf Data Science Anwendungen stellt das Buch nun ausführlich die Pakete dplyr zur Datenaufbereitung und ggplot2 für Diagramme vor. Darüber hinaus enthält das Buch eine Darstellung von dynamischen R Markdown Dokumenten zur Unterstützung reproduzierbarer Auswertungen.
R-Calculus, V: Description Logics (Perspectives in Formal Induction, Revision and Evolution)
by Wei Li Yuefei SuiThis book series consists of two parts, decidable description logics and undecidable description logics. It gives the R-calculi for description logics. This book offers a rich blend of theory and practice. It is suitable for students, researchers and practitioners in the field of logic.
R-Calculus, VI: Finite Injury Priority Method (Perspectives in Formal Induction, Revision and Evolution)
by Wei Li Yuefei SuiThis sixth volume of the book series applies finite injury priority method to R-calculi and obtain (in)completeness theorem for binary-valued, Post three-valued, B2^2-valued and L4-valued first-order logics, and extend the method to infinite injury priority method and 0"-method for default logic to produce pseudo-extensions of a default theory, corresponding to different R-calculi. Finite injury priority method and tree constructions are discussed in this book. This book offers a rich blend of theory and practice. It is suitable for students, researchers and practitioners in the field of logic.
