- Table View
- List View
Statistics Crash Course for Beginners: Theory and applications of Frequentist and Bayesian statistics using Python
by AI Sciences OUA beginner-friendly crash course to statistics utilizing Python with an eye to preparing students for further study in machine learningKey FeaturesA quick introduction to Python for statisticsHands-on projects for guided practiceInstant access to PDFs, Python codes, exercises, and references on the publisher's website at no extra costBook DescriptionData and statistics are the core subjects of Machine Learning (ML). The reality is that the average programmer may be tempted to view statistics with disinterest. But if you want to exploit the incredible power of ML, you need a thorough understanding of statistics. The reason is that a machine learning professional develops intelligent and fast algorithms that learn from data. This Statistics Crash Course for Beginners presents you with an easy way of learning statistics fast.Contrary to popular belief, statistics is no longer the exclusive domain of math PhDs. It's true that statistics deals with numbers and percentages. Hence, the subject can be very dry and boring. This book, however, transforms statistics into a fun subject.Frequentist and Bayesian statistics are two statistical techniques that interpret the concept of probability in different ways. Bayesian statistics was first introduced by Thomas Bayes in the 1770s. Bayesian statistics has been instrumental in the design of high-end algorithms that make accurate predictions. So, even after 250 years, the interest in Bayesian statistics has not faded. In fact, it has accelerated tremendously.Frequentist statistics is just as important as Bayesian statistics. In the statistical universe, Frequentist statistics is the most popular inferential technique. In fact, it's the first school of thought you come across when you enter the statistics world.By the end of this course, you will have built a solid foundation in statistical theory and practice that will prepare you for further study in machine learning and a career in programming. The code bundle for this course is available at https://www.aispublishing.net/nlp-crash-course1605125706681What you will learnGet a crash course in Python for statisticsUtilize Python to determine probability, random variables, and probability distributionsStudy descriptive statistics, measuring central tendency and spreadPerform exploratory analysis, such as data visualizationPractice statistical inference, frequentist inference, and Bayesian inferenceSuccessfully complete several real-world projectsWho this book is forThis course is intended for anyone interested in learning Frequentist and Bayesian statistics, either as a first step to machine learning or basic programming. No prior experience is required.
Statistics Every Programmer Needs
by Gary SuttonPut statistics into practice with Python!Data-driven decisions rely on statistics. Statistics Every Programmer Needs introduces the statistical and quantitative methods that will help you go beyond &“gut feeling&” for tasks like predicting stock prices or assessing quality control, with examples using the rich tools of the Python ecosystem. Statistics Every Programmer Needs will teach you how to: • Apply foundational and advanced statistical techniques • Build predictive models and simulations • Optimize decisions under constraints • Interpret and validate results with statistical rigor • Implement quantitative methods using Python In this hands-on guide, stats expert Gary Sutton blends the theory behind these statistical techniques with practical Python-based applications, offering structured, reproducible, and defensible methods for tackling complex decisions. Well-annotated and reusable Python code listings illustrate each method, with examples you can follow to practice your new skills. About the technology Whether you&’re analyzing application performance metrics, creating relevant dashboards and reports, or immersing yourself in a numbers-heavy coding project, every programmer needs to know how to turn raw data into actionable insight. Statistics and quantitative analysis are the essential tools every programmer needs to clarify uncertainty, optimize outcomes, and make informed choices. About the book Statistics Every Programmer Needs teaches you how to apply statistics to the everyday problems you&’ll face as a software developer. Each chapter is a new tutorial. You&’ll predict ultramarathon times using linear regression, forecast stock prices with time series models, analyze system reliability using Markov chains, and much more. The book emphasizes a balance between theory and hands-on Python implementation, with annotated code and real-world examples to ensure practical understanding and adaptability across industries. What's inside • Probability basics and distributions • Random variables • Regression • Decision trees and random forests • Time series analysis • Linear programming • Monte Carlo and Markov methods and much more About the reader Examples are in Python. About the author Gary Sutton is a business intelligence and analytics leader and the author of Statistics Slam Dunk: Statistical analysis with R on real NBA data. Table of Contents 1 Laying the groundwork 2 Exploring probability and counting 3 Exploring probability distributions and conditional probabilities 4 Fitting a linear regression 5 Fitting a logistic regression 6 Fitting a decision tree and a random forest 7 Fitting time series models 8 Transforming data into decisions with linear programming 9 Running Monte Carlo simulations 10 Building and plotting a decision tree 11 Predicting future states with Markov analysis 12 Examining and testing naturally occurring number sequences 13 Managing projects 14 Visualizing quality control
Statistics Hacks: Tips & Tools for Measuring the World and Beating the Odds
by Bruce FreyWant to calculate the probability that an event will happen? Be able to spot fake data? Prove beyond doubt whether one thing causes another? Or learn to be a better gambler? You can do that and much more with 75 practical and fun hacks packed into Statistics Hacks. These cool tips, tricks, and mind-boggling solutions from the world of statistics, measurement, and research methods will not only amaze and entertain you, but will give you an advantage in several real-world situations-including business.This book is ideal for anyone who likes puzzles, brainteasers, games, gambling, magic tricks, and those who want to apply math and science to everyday circumstances. Several hacks in the first chapter alone-such as the "central limit theorem,", which allows you to know everything by knowing just a little-serve as sound approaches for marketing and other business objectives. Using the tools of inferential statistics, you can understand the way probability works, discover relationships, predict events with uncanny accuracy, and even make a little money with a well-placed wager here and there.Statistics Hacks presents useful techniques from statistics, educational and psychological measurement, and experimental research to help you solve a variety of problems in business, games, and life. You'll learn how to:Play smart when you play Texas Hold 'Em, blackjack, roulette, dice games, or even the lotteryDesign your own winnable bar bets to make money and amaze your friendsPredict the outcomes of baseball games, know when to "go for two" in football, and anticipate the winners of other sporting events with surprising accuracyDemystify amazing coincidences and distinguish the truly random from the only seemingly random--even keep your iPod's "random" shuffle honestSpot fraudulent data, detect plagiarism, and break codesHow to isolate the effects of observation on the thing observedWhether you're a statistics enthusiast who does calculations in your sleep or a civilian who is entertained by clever solutions to interesting problems, Statistics Hacks has tools to give you an edge over the world's slim odds.
Statistics Slam Dunk
by Gary SuttonLearn statistics by analyzing professional basketball data! In this action-packed book, you&’ll build your skills in exploratory data analysis by digging into the fascinating world of NBA games and player stats using the R language.Statistics Slam Dunk is an engaging how-to guide for statistical analysis with R. Each chapter contains an end-to-end data science or statistics project delving into NBA data and revealing real-world sporting insights. Written by a former basketball player turned business intelligence and analytics leader, you&’ll get practical experience tidying, wrangling, exploring, testing, modeling, and otherwise analyzing data with the best and latest R packages and functions. In Statistics Slam Dunk you&’ll develop a toolbox of R programming skills including: Reading and writing data Installing and loading packages Transforming, tidying, and wrangling data Applying best-in-class exploratory data analysis techniques Creating compelling visualizations Developing supervised and unsupervised machine learning algorithms Executing hypothesis tests, including t-tests and chi-square tests for independence Computing expected values, Gini coefficients, z-scores, and other measures If you&’re looking to switch to R from another language, or trade base R for tidyverse functions, this book is the perfect training coach. Much more than a beginner&’s guide, it teaches statistics and data science methods that have tons of use cases. And just like in the real world, you&’ll get no clean pre-packaged data sets in Statistics Slam Dunk. You&’ll take on the challenge of wrangling messy data to drill on the skills that will make you the star player on any data team. Foreword by Thomas W. Miller. About the technology Statistics Slam Dunk is a data science manual with a difference. Each chapter is a complete, self-contained statistics or data science project for you to work through—from importing data, to wrangling it, testing it, visualizing it, and modeling it. Throughout the book, you&’ll work exclusively with NBA data sets and the R language, applying best-in-class statistics techniques to reveal fun and fascinating truths about the NBA. About the book Is losing basketball games on purpose a rational strategy? Which hustle statistics have an impact on wins and losses? Does spending more on player salaries translate into a winning record? You&’ll answer all these questions and more. Plus, R&’s visualization capabilities shine through in the book&’s 300 plots and charts, including Pareto charts, Sankey diagrams, Cleveland dot plots, and dendrograms. About the reader For readers who know basic statistics. No advanced knowledge of R—or basketball—required. About the author Gary Sutton is a former basketball player who has built and led high-performing business intelligence and analytics organizations across multiple verticals. Table of Contents 1 Getting started 2 Exploring data 3 Segmentation analysis 4 Constrained optimization 5 Regression models 6 More wrangling and visualizing data 7 T-testing and effect size testing 8 Optimal stopping 9 Chi-square testing and more effect size testing 10 Doing more with ggplot2 11 K-means clustering 12 Computing and plotting inequality 13 More with Gini coefficients and Lorenz curves 14 Intermediate and advanced modeling 15 The Lindy effect 16 Randomness versus causality 17 Collective intelligence
Statistics Today: Everyday Applications, Research Questions, Insights, and Challenges (Society, Environment and Statistics)
by Walter Krämer Claus Weihs Sarah BuschfeldThis book offers a broad selection of statistical applications to everyday situations, illustrating how exciting and diverse statistical analysis can be. It covers a wide variety of topics, including offering hearing-impaired people the option to enjoy music, extracting meaningful quantitative data from texts, and modeling flood disasters to help get a better grip on them. Most of the examples are not typically found in textbooks but directly relate to real-life problems encountered by the “average person”, including topics relevant for sustainable development.Technical jargon and formalism have been avoided as much as possible, and a detailed statistical background is not assumed of the reader, making the book accessible to anyone interested in current research in statistical applications. Providing an unobscured look at a thoroughly fascinating science, it will help students to develop enthusiasm for statistical issues and methods, and may even inspire ideas for their own projects.

Statistics Using IBM SPSS: An Integrative Approach
by Sharon Lawner Weinberg Sarah Knapp AbramowitzWritten in a clear and lively tone, Statistics Using IBM SPSS provides a data-centric approach to statistics with integrated SPSS (version 22) commands, ensuring that students gain both a deep conceptual understanding of statistics and practical facility with the leading statistical software package. With 100 worked examples, the textbook guides students through statistical practice using real data and avoids complicated mathematics. Numerous end-of-chapter exercises allow students to apply and test their understanding of chapter topics, with detailed answers available online. The third edition has been updated throughout and includes a new chapter on research design, new topics (including weighted mean, resampling with the bootstrap, the role of the syntax file in workflow management, and regression to the mean), and new examples and exercises. Student learning is supported by a rich suite of online resources, including answers to end-of-chapter exercises, real data sets, PowerPoint slides, and a test bank. Avoids calculus and linear algebra and instead grounds concepts in real data examples to ensure simple and clear explanation. Written by highly experienced teachers. Chapter examples and exercises are based on real data, which enables students to understand what it truly means to be a data analys.
Statistics With Microsoft Excel (Fifth Edition)
by Beverly DretzkeStatistics with Microsoft Excel, Fifth Edition, shows readers how to use Microsoft Excel® to perform statistical analysis. This step-by-step guide has been updated to cover the new features and interface of Excel 2010. Datasets and other resources (where applicable) for this book are available here.
Statistics and Analysis of Scientific Data
by Massimiliano BonamenteThe revised second edition of this textbook provides the reader with a solid foundation in probability theory and statistics as applied to the physical sciences, engineering and related fields. It covers a broad range of numerical and analytical methods that are essential for the correct analysis of scientific data, including probability theory, distribution functions of statistics, fits to two-dimensional data and parameter estimation, Monte Carlo methods and Markov chains. Features new to this edition include: * a discussion of statistical techniques employed in business science, such as multiple regression analysis of multivariate datasets. * a new chapter on the various measures of the mean including logarithmic averages. * new chapters on systematic errors and intrinsic scatter, and on the fitting of data with bivariate errors. * a new case study and additional worked examples. * mathematical derivations and theoretical background material have been appropriately marked, to improve the readability of the text. * end-of-chapter summary boxes, for easy reference. As in the first edition, the main pedagogical method is a theory-then-application approach, where emphasis is placed first on a sound understanding of the underlying theory of a topic, which becomes the basis for an efficient and practical application of the material. The level is appropriate for undergraduates and beginning graduate students, and as a reference for the experienced researcher. Basic calculus is used in some of the derivations, and no previous background in probability and statistics is required. The book includes many numerical tables of data, as well as exercises and examples to aid the readers' understanding of the topic.
Statistics and Data Analysis for Engineers and Scientists (Transactions on Computer Systems and Networks)
by Tanvir Mustafy Md. Tauhid RahmanThis textbook summarizes the different statistical, scientific, and financial data analysis methods for users ranging from a high school level to a professional level. It aims to combine the data analysis methods using three different programs—Microsoft Excel, SPSS, and MATLAB. The book combining the different data analysis tools is a unique approach. The book presents a variety of real-life problems in data analysis and machine learning, delivering the best solution. Analysis methods presented in this book include but are not limited to, performing various algebraic and trigonometric operations, regression modeling, and correlation, as well as plotting graphs and charts to represent the results. Fundamental concepts of applied statistics are also explained here, with illustrative examples. Thus, this book presents a pioneering solution to help a wide range of students, researchers, and professionals learn data processing, interpret different findings derived from the analyses, and apply them to their research or professional fields. The book also includes worked examples of practical problems. The primary focus behind designing these examples is understanding the concepts of data analysis and how it can solve problems. The chapters include practice exercises to assist users in enhancing their skills to execute statistical analysis calculations using software instead of relying on tables for probabilities and percentiles in the present world.
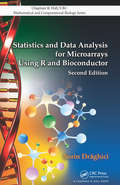
Statistics and Data Analysis for Microarrays Using R and Bioconductor (Chapman & Hall/CRC Computational Biology Series)
by Sorin DraghiciRichly illustrated in color, Statistics and Data Analysis for Microarrays Using R and Bioconductor, Second Edition provides a clear and rigorous description of powerful analysis techniques and algorithms for mining and interpreting biological information. Omitting tedious details, heavy formalisms, and cryptic notations, the text takes a hands-on, example-based approach that teaches students the basics of R and microarray technology as well as how to choose and apply the proper data analysis tool to specific problems.New to the Second EditionCompletely updated and double the size of its predecessor, this timely second edition replaces the commercial software with the open source R and Bioconductor environments. Fourteen new chapters cover such topics as the basic mechanisms of the cell, reliability and reproducibility issues in DNA microarrays, basic statistics and linear models in R, experiment design, multiple comparisons, quality control, data pre-processing and normalization, Gene Ontology analysis, pathway analysis, and machine learning techniques. Methods are illustrated with toy examples and real data and the R code for all routines is available on an accompanying downloadable resource.With all the necessary prerequisites included, this best-selling book guides students from very basic notions to advanced analysis techniques in R and Bioconductor. The first half of the text presents an overview of microarrays and the statistical elements that form the building blocks of any data analysis. The second half introduces the techniques most commonly used in the analysis of microarray data.
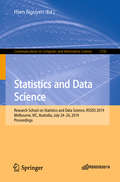
Statistics and Data Science: Research School on Statistics and Data Science, RSSDS 2019, Melbourne, VIC, Australia, July 24–26, 2019, Proceedings (Communications in Computer and Information Science #1150)
by Hien NguyenThis book constitutes the proceedings of the Research School on Statistics and Data Science, RSSDS 2019, held in Melbourne, VIC, Australia, in July 2019. The 11 papers presented in this book were carefully reviewed and selected from 23 submissions. The volume also contains 7 invited talks. The workshop brought together academics, researchers, and industry practitioners of statistics and data science, to discuss numerous advances in the disciplines and their impact on the sciences and society. The topics covered are data analysis, data science, data mining, data visualization, bioinformatics, machine learning, neural networks, statistics, and probability.
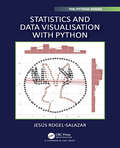
Statistics and Data Visualisation with Python (Chapman & Hall/CRC The Python Series)
by Jesus Rogel-SalazarThis book is intended to serve as a bridge in statistics for graduates and business practitioners interested in using their skills in the area of data science and analytics as well as statistical analysis in general. On the one hand, the book is intended to be a refresher for readers who have taken some courses in statistics, but who have not necessarily used it in their day-to-day work. On the other hand, the material can be suitable for readers interested in the subject as a first encounter with statistical work in Python. Statistics and Data Visualisation with Python aims to build statistical knowledge from the ground up by enabling the reader to understand the ideas behind inferential statistics and begin to formulate hypotheses that form the foundations for the applications and algorithms in statistical analysis, business analytics, machine learning, and applied machine learning. This book begins with the basics of programming in Python and data analysis, to help construct a solid basis in statistical methods and hypothesis testing, which are useful in many modern applications.
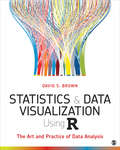
Statistics and Data Visualization Using R: The Art and Practice of Data Analysis
by David S. BrownDesigned to introduce students to quantitative methods in a way that can be applied to all kinds of data in all kinds of situations, Statistics and Data Visualization Using R: The Art and Practice of Data Analysis by David S. Brown teaches students statistics through charts, graphs, and displays of data that help students develop intuition around statistics as well as data visualization skills. By focusing on the visual nature of statistics instead of mathematical proofs and derivations, students can see the relationships between variables that are the foundation of quantitative analysis. Using the latest tools in R and R RStudio® for calculations and data visualization, students learn valuable skills they can take with them into a variety of future careers in the public sector, the private sector, or academia. Starting at the most basic introduction to data and going through most crucial statistical methods, this introductory textbook quickly gets students new to statistics up to speed running analyses and interpreting data from social science research.
Statistics and Machine Learning Methods for EHR Data: From Data Extraction to Data Analytics (Chapman & Hall/CRC Healthcare Informatics Series)
by Hulin Wu Jose-Miguel Yamal Ashraf Yaseen Vahed MaroufyThe use of Electronic Health Records (EHR)/Electronic Medical Records (EMR) data is becoming more prevalent for research. However, analysis of this type of data has many unique complications due to how they are collected, processed and types of questions that can be answered. This book covers many important topics related to using EHR/EMR data for research including data extraction, cleaning, processing, analysis, inference, and predictions based on many years of practical experience of the authors. The book carefully evaluates and compares the standard statistical models and approaches with those of machine learning and deep learning methods and reports the unbiased comparison results for these methods in predicting clinical outcomes based on the EHR data. Key Features: Written based on hands-on experience of contributors from multidisciplinary EHR research projects, which include methods and approaches from statistics, computing, informatics, data science and clinical/epidemiological domains. Documents the detailed experience on EHR data extraction, cleaning and preparation Provides a broad view of statistical approaches and machine learning prediction models to deal with the challenges and limitations of EHR data. Considers the complete cycle of EHR data analysis. The use of EHR/EMR analysis requires close collaborations between statisticians, informaticians, data scientists and clinical/epidemiological investigators. This book reflects that multidisciplinary perspective.
Statistics by Simulation: A Synthetic Data Approach
by Aaron M. Ellison Carsten F. DormannAn accessible guide to understanding statistics using simulations, with examples from a range of scientific disciplinesReal-world challenges such as small sample sizes, skewed distributions of data, biased sampling designs, and more predictors than data points are pushing the limits of classical statistical analysis. This textbook provides a new tool for the statistical toolkit: data simulations. It shows that using simulation and data-generating models is an excellent way to validate statistical reasoning and to augment study design and statistical analysis with planning and visualization. Although data simulations are not new to professional statisticians, Statistics by Simulation makes the approach accessible to a broader audience, with examples from many fields. It introduces the reasoning behind data simulation and then shows how to apply it in planning experiments or observational studies, developing analytical workflows, deploying model diagnostics, and developing new indices and statistical methods.• Covers all steps of statistical practice, from planning projects to post-hoc analysis and model checking• Provides examples from disciplines including sociology, psychology, ecology, economics, physics, and medicine• Includes R code for all examples, with data and code freely available online• Offers bullet-point outlines and summaries of each chapter• Minimizes the use of jargon and requires only basic statistical background and skills
Statistics for Big Data For Dummies
by David Semmelroth Alan AndersonThe fast and easy way to make sense of statistics for big data Does the subject of data analysis make you dizzy? You've come to the right place! Statistics For Big Data For Dummies breaks this often-overwhelming subject down into easily digestible parts, offering new and aspiring data analysts the foundation they need to be successful in the field. Inside, you'll find an easy-to-follow introduction to exploratory data analysis, the lowdown on collecting, cleaning, and organizing data, everything you need to know about interpreting data using common software and programming languages, plain-English explanations of how to make sense of data in the real world, and much more. Data has never been easier to come by, and the tools students and professionals need to enter the world of big data are based on applied statistics. While the word "statistics" alone can evoke feelings of anxiety in even the most confident student or professional, it doesn't have to. Written in the familiar and friendly tone that has defined the For Dummies brand for more than twenty years, Statistics For Big Data For Dummies takes the intimidation out of the subject, offering clear explanations and tons of step-by-step instruction to help you make sense of data mining--without losing your cool. Helps you to identify valid, useful, and understandable patterns in data Provides guidance on extracting previously unknown information from large databases Shows you how to discover patterns available in big data Gives you access to the latest tools and techniques for working in big data If you're a student enrolled in a related Applied Statistics course or a professional looking to expand your skillset, Statistics For Big Data For Dummies gives you access to everything you need to succeed.
Statistics for Data Science
by James D. MillerGet your statistics basics right before diving into the world of data science About This Book • No need to take a degree in statistics, read this book and get a strong statistics base for data science and real-world programs; • Implement statistics in data science tasks such as data cleaning, mining, and analysis • Learn all about probability, statistics, numerical computations, and more with the help of R programs Who This Book Is For This book is intended for those developers who are willing to enter the field of data science and are looking for concise information of statistics with the help of insightful programs and simple explanation. Some basic hands on R will be useful. What You Will Learn • Analyze the transition from a data developer to a data scientist mindset • Get acquainted with the R programs and the logic used for statistical computations • Understand mathematical concepts such as variance, standard deviation, probability, matrix calculations, and more • Learn to implement statistics in data science tasks such as data cleaning, mining, and analysis • Learn the statistical techniques required to perform tasks such as linear regression, regularization, model assessment, boosting, SVMs, and working with neural networks • Get comfortable with performing various statistical computations for data science programmatically In Detail Data science is an ever-evolving field, which is growing in popularity at an exponential rate. Data science includes techniques and theories extracted from the fields of statistics; computer science, and, most importantly, machine learning, databases, data visualization, and so on. This book takes you through an entire journey of statistics, from knowing very little to becoming comfortable in using various statistical methods for data science tasks. It starts off with simple statistics and then move on to statistical methods that are used in data science algorithms. The R programs for statistical computation are clearly explained along with logic. You will come across various mathematical concepts, such as variance, standard deviation, probability, matrix calculations, and more. You will learn only what is required to implement statistics in data science tasks such as data cleaning, mining, and analysis. You will learn the statistical techniques required to perform tasks such as linear regression, regularization, model assessment, boosting, SVMs, and working with neural networks. By the end of the book, you will be comfortable with performing various statistical computations for data science programmatically. Style and approach Step by step comprehensive guide with real world examples
Statistics for Data Science and Analytics
by Peter C. Bruce Peter Gedeck Janet DobbinsIntroductory statistics textbook with a focus on data science topics such as prediction, correlation, and data exploration Statistics for Data Science and Analytics is a comprehensive guide to statistical analysis using Python, presenting important topics useful for data science such as prediction, correlation, and data exploration. The authors provide an introduction to statistical science and big data, as well as an overview of Python data structures and operations. A range of statistical techniques are presented with their implementation in Python, including hypothesis testing, probability, exploratory data analysis, categorical variables, surveys and sampling, A/B testing, and correlation. The text introduces binary classification, a foundational element of machine learning, validation of statistical models by applying them to holdout data, and probability and inference via the easy-to-understand method of resampling and the bootstrap instead of using a myriad of “kitchen sink” formulas. Regression is taught both as a tool for explanation and for prediction. This book is informed by the authors’ experience designing and teaching both introductory statistics and machine learning at Statistics.com. Each chapter includes practical examples, explanations of the underlying concepts, and Python code snippets to help readers apply the techniques themselves. Statistics for Data Science and Analytics includes information on sample topics such as: Int, float, and string data types, numerical operations, manipulating strings, converting data types, and advanced data structures like lists, dictionaries, and setsExperiment design via randomizing, blinding, and before-after pairing, as well as proportions and percents when handling binary dataSpecialized Python packages like numpy, scipy, pandas, scikit-learn and statsmodels—the workhorses of data science—and how to get the most value from themStatistical versus practical significance, random number generators, functions for code reuse, and binomial and normal probability distributions Written by and for data science instructors, Statistics for Data Science and Analytics is an excellent learning resource for data science instructors prescribing a required intro stats course for their programs, as well as other students and professionals seeking to transition to the data science field.
Statistics for Data Science and Policy Analysis
by Azizur RahmanThis book brings together the best contributions of the Applied Statistics and Policy Analysis Conference 2019. Written by leading international experts in the field of statistics, data science and policy evaluation. This book explores the theme of effective policy methods through the use of big data, accurate estimates and modern computing tools and statistical modelling.
Statistics for Health Data Science: An Organic Approach (Springer Texts in Statistics)
by Ruth Etzioni Micha Mandel Roman GulatiStudents and researchers in the health sciences are faced with greater opportunity and challenge than ever before. The opportunity stems from the explosion in publicly available data that simultaneously informs and inspires new avenues of investigation. The challenge is that the analytic tools required go far beyond the standard methods and models of basic statistics. This textbook aims to equip health care researchers with the most important elements of a modern health analytics toolkit, drawing from the fields of statistics, health econometrics, and data science. This textbook is designed to overcome students’ anxiety about data and statistics and to help them to become confident users of appropriate analytic methods for health care research studies. Methods are presented organically, with new material building naturally on what has come before. Each technique is motivated by a topical research question, explained in non-technical terms, and accompanied by engaging explanations and examples. In this way, the authors cultivate a deep (“organic”) understanding of a range of analytic techniques, their assumptions and data requirements, and their advantages and limitations. They illustrate all lessons via analyses of real data from a variety of publicly available databases, addressing relevant research questions and comparing findings to those of published studies. Ultimately, this textbook is designed to cultivate health services researchers that are thoughtful and well informed about health data science, rather than data analysts. This textbook differs from the competition in its unique blend of methods and its determination to ensure that readers gain an understanding of how, when, and why to apply them. It provides the public health researcher with a way to think analytically about scientific questions, and it offers well-founded guidance for pairing data with methods for valid analysis. Readers should feel emboldened to tackle analysis of real public datasets using traditional statistical models, health econometrics methods, and even predictive algorithms. Accompanying code and data sets are provided in an author site: https://roman-gulati.github.io/statistics-for-health-data-science/
Statistics for Innovation I: SIS 2025, Short Papers, Plenary, Specialized, and Solicited Sessions (Italian Statistical Society Series on Advances in Statistics)
by Enrico Di Bella Vincenzo Gioia Corrado Lagazio Susanna ZaccarinThis book presents peer-reviewed short papers on methodological and applied statistical research presented at the Italian Statistical Society&’s international conference on &“Statistics for Innovation&”, SIS 2025, held in Genoa, Italy, June 16-18, 2025. It is the first of four volumes, featuring invited contributions presented in the Plenary, Specialized and Solicited Sessions. Providing a comprehensive overview of innovations in modern statistical methods and applications, the volumes address a large number of topics of current interest, contributing to a rapid dissemination of quantitative methods for data analysis across the various fields of scientific research and social life. The volumes underpin the role of statistics and data science in fostering innovation in numerous fields, including business, industry, finance, technology, environment, health and medicine, official statistics, public policy, welfare, social issues and sustainable development. One of the aims of the Italian Statistical Society (SIS) is to promote scientific activities for the development of statistical sciences. Together with the biennial international Scientific Meeting, the intermediate international statistical conferences on a particular topic of interest represent the Society&’s most important events which bring together national and international researchers and professionals to exchange ideas and discuss recent advances and developments in theoretical and applied statistics.
Statistics for Innovation II: SIS 2025, Short Papers, Contributed Sessions 1 (Italian Statistical Society Series on Advances in Statistics)
by Enrico Di Bella Vincenzo Gioia Corrado Lagazio Susanna ZaccarinThis book presents peer-reviewed short papers on methodological and applied statistical research presented at the Italian Statistical Society&’s international conference on &“Statistics for Innovation&”, SIS 2025, held in Genoa, Italy, June 16-18, 2025. It is the second of four volumes, featuring the first part of the contributions presented in the Contributed Sessions. Providing a comprehensive overview of innovations in modern statistical methods and applications, the volumes address a large number of topics of current interest, contributing to a rapid dissemination of quantitative methods for data analysis across the various fields of scientific research and social life. The volumes underpin the role of statistics and data science in fostering innovation in numerous fields, including business, industry, finance, technology, environment, health and medicine, official statistics, public policy, welfare, social issues and sustainable development. One of the aims of the Italian Statistical Society (SIS) is to promote scientific activities for the development of statistical sciences. Together with the biennial international Scientific Meeting, the intermediate international statistical conferences on a particular topic of interest represent the Society&’s most important events which bring together national and international researchers and professionals to exchange ideas and discuss recent advances and developments in theoretical and applied statistics.
Statistics for Innovation III: SIS 2025, Short Papers, Contributed Sessions 2 (Italian Statistical Society Series on Advances in Statistics)
by Enrico Di Bella Vincenzo Gioia Corrado Lagazio Susanna ZaccarinThis book presents peer-reviewed short papers on methodological and applied statistical research presented at the Italian Statistical Society&’s international conference on &“Statistics for Innovation&”, SIS 2025, held in Genoa, Italy, June 16-18, 2025. It is the third of four volumes, featuring the second part of the contributions presented in the Contributed Sessions. Providing a comprehensive overview of innovations in modern statistical methods and applications, the volumes address a large number of topics of current interest, contributing to a rapid dissemination of quantitative methods for data analysis across the various fields of scientific research and social life. The volumes underpin the role of statistics and data science in fostering innovation in numerous fields, including business, industry, finance, technology, environment, health and medicine, official statistics, public policy, welfare, social issues and sustainable development. One of the aims of the Italian Statistical Society (SIS) is to promote scientific activities for the development of statistical sciences. Together with the biennial international Scientific Meeting, the intermediate international statistical conferences on a particular topic of interest represent the Society&’s most important events which bring together national and international researchers and professionals to exchange ideas and discuss recent advances and developments in theoretical and applied statistics.
Statistics for Innovation IV: SIS 2025, Short Papers, Contributed Sessions 3 (Italian Statistical Society Series on Advances in Statistics)
by Enrico Di Bella Vincenzo Gioia Corrado Lagazio Susanna ZaccarinThis book presents peer-reviewed short papers on methodological and applied statistical research presented at the Italian Statistical Society&’s international conference on &“Statistics for Innovation&”, SIS 2025, held in Genoa, Italy, June 16-18, 2025. It is the last of four volumes, featuring the third part of the contributions presented in the Contributed Sessions. Providing a comprehensive overview of innovations in modern statistical methods and applications, the volumes address a large number of topics of current interest, contributing to a rapid dissemination of quantitative methods for data analysis across the various fields of scientific research and social life. The volumes underpin the role of statistics and data science in fostering innovation in numerous fields, including business, industry, finance, technology, environment, health and medicine, official statistics, public policy, welfare, social issues and sustainable development. One of the aims of the Italian Statistical Society (SIS) is to promote scientific activities for the development of statistical sciences. Together with the biennial international Scientific Meeting, the intermediate international statistical conferences on a particular topic of interest represent the Society&’s most important events which bring together national and international researchers and professionals to exchange ideas and discuss recent advances and developments in theoretical and applied statistics.