- Table View
- List View
Theory of Cryptography: 16th International Conference, Tcc 2018, Panaji, India, November 11-14, 2018, Proceedings, Part Ii (Lecture Notes in Computer Science #11240)
by Amos Beimel Stefan DziembowskiThe two-volume set of LNCS 11239 and LNCS 11240 constitutes the revised proceedings of the 16th International Conference on Theory of Cryptography, TCC 2018, held in Panaji, India, in November 2018.The total of 50 revised full papers presented in the proceedings were carefully reviewed and selected from 168 submissions. The Theory of Cryptography Conference deals with the paradigms, approaches, and techniques used to conceptualize natural cryptographic problems and provide algorithmic solutions to them and much more.
Theory of Cryptography: 17th International Conference, TCC 2019, Nuremberg, Germany, December 1–5, 2019, Proceedings, Part I (Lecture Notes in Computer Science #11891)
by Dennis Hofheinz Alon RosenThe two-volume set LNCS 11891 and 11892 constitutes the proceedings of the 17th International Conference on Theory of Cryptography, TCC 2019, held in Nuremberg, Germany, in December 2019.The 43 full papers presented were carefully reviewed and selected from 147 submissions. The Theory of Cryptography Conference deals with the paradigms, approaches, and techniques used to conceptualize natural cryptographic problems and provide algorithmic solutions to them and much more.
Theory of Cryptography: 17th International Conference, TCC 2019, Nuremberg, Germany, December 1–5, 2019, Proceedings, Part II (Lecture Notes in Computer Science #11892)
by Dennis Hofheinz Alon RosenThe two-volume set LNCS 11891 and 11892 constitutes the proceedings of the 17th International Conference on Theory of Cryptography, TCC 2019, held in Nuremberg, Germany, in December 2019.The 43 full papers presented were carefully reviewed and selected from 147 submissions. The Theory of Cryptography Conference deals with the paradigms, approaches, and techniques used to conceptualize natural cryptographic problems and provide algorithmic solutions to them and much more.
Theory of Cryptography: 18th International Conference, TCC 2020, Durham, NC, USA, November 16–19, 2020, Proceedings, Part I (Lecture Notes in Computer Science #12550)
by Rafael Pass Krzysztof PietrzakThis three-volume set, LNCS 12550, 12551, and 12552, constitutes the refereed proceedings of the 18th International Conference on Theory of Cryptography, TCCC 2020, held in Durham, NC, USA, in November 2020. The total of 71 full papers presented in this three-volume set was carefully reviewed and selected from 167 submissions. Amongst others they cover the following topics: study of known paradigms, approaches, and techniques, directed towards their better understanding and utilization; discovery of new paradigms, approaches and techniques that overcome limitations of the existing ones, formulation and treatment of new cryptographic problems; study of notions of security and relations among them; modeling and analysis of cryptographic algorithms; and study of the complexity assumptions used in cryptography. Due to the Corona pandemic this event was held virtually.
Theory of Cryptography: 18th International Conference, TCC 2020, Durham, NC, USA, November 16–19, 2020, Proceedings, Part II (Lecture Notes in Computer Science #12551)
by Rafael Pass Krzysztof PietrzakThis three-volume set, LNCS 12550, 12551, and 12552, constitutes the refereed proceedings of the 18th International Conference on Theory of Cryptography, TCCC 2020, held in Durham, NC, USA, in November 2020. The total of 71 full papers presented in this three-volume set was carefully reviewed and selected from 167 submissions. Amongst others they cover the following topics: study of known paradigms, approaches, and techniques, directed towards their better understanding and utilization; discovery of new paradigms, approaches and techniques that overcome limitations of the existing ones, formulation and treatment of new cryptographic problems; study of notions of security and relations among them; modeling and analysis of cryptographic algorithms; and study of the complexity assumptions used in cryptography. Due to the Corona pandemic this event was held virtually.
Theory of Cryptography: 18th International Conference, TCC 2020, Durham, NC, USA, November 16–19, 2020, Proceedings, Part III (Lecture Notes in Computer Science #12552)
by Rafael Pass Krzysztof PietrzakThis three-volume set, LNCS 12550, 12551, and 12552, constitutes the refereed proceedings of the 18th International Conference on Theory of Cryptography, TCCC 2020, held in Durham, NC, USA, in November 2020. The total of 71 full papers presented in this three-volume set was carefully reviewed and selected from 167 submissions. Amongst others they cover the following topics: study of known paradigms, approaches, and techniques, directed towards their better understanding and utilization; discovery of new paradigms, approaches and techniques that overcome limitations of the existing ones, formulation and treatment of new cryptographic problems; study of notions of security and relations among them; modeling and analysis of cryptographic algorithms; and study of the complexity assumptions used in cryptography. Due to the Corona pandemic this event was held virtually.
Theory of Cryptography: 19th International Conference, TCC 2021, Raleigh, NC, USA, November 8–11, 2021, Proceedings, Part I (Lecture Notes in Computer Science #13042)
by Brent Waters Kobbi NissimThe three-volume set LNCS 13042, LNCS 13043 and LNCS 13044 constitutes the refereed proceedings of the 19th International Conference on Theory of Cryptography, TCC 2021, held in Raleigh, NC, USA, in November 2021. The total of 66 full papers presented in this three-volume set was carefully reviewed and selected from 161 submissions. They cover topics on proof systems, attribute-based and functional encryption, obfuscation, key management and secure communication.
Theory of Cryptography: 19th International Conference, TCC 2021, Raleigh, NC, USA, November 8–11, 2021, Proceedings, Part II (Lecture Notes in Computer Science #13043)
by Brent Waters Kobbi NissimThe three-volume set LNCS 13042, LNCS 13043 and LNCS 13044 constitutes the refereed proceedings of the 19th International Conference on Theory of Cryptography, TCC 2021, held in Raleigh, NC, USA, in November 2021. The total of 66 full papers presented in this three-volume set was carefully reviewed and selected from 161 submissions. They cover topics on proof systems, attribute-based and functional encryption, obfuscation, key management and secure communication.
Theory of Cryptography: 19th International Conference, TCC 2021, Raleigh, NC, USA, November 8–11, 2021, Proceedings, Part III (Lecture Notes in Computer Science #13044)
by Brent Waters Kobbi NissimThe three-volume set LNCS 13042, LNCS 13043 and LNCS 13044 constitutes the refereed proceedings of the 19th International Conference on Theory of Cryptography, TCC 2021, held in Raleigh, NC, USA, in November 2021. The total of 66 full papers presented in this three-volume set was carefully reviewed and selected from 161 submissions. They cover topics on proof systems, attribute-based and functional encryption, obfuscation, key management and secure communication.
Theory of Cryptography: 20th International Conference, TCC 2022, Chicago, IL, USA, November 7–10, 2022, Proceedings, Part I (Lecture Notes in Computer Science #13747)
by Eike Kiltz Vinod VaikuntanathanThe three-volume set LNCS 13747, LNCS 13748 and LNCS 13749 constitutes the refereed proceedings of the 20th International Conference on Theory of Cryptography, TCC 2022, held in Chicago, IL, USA, in November 2022. The total of 60 full papers presented in this three-volume set was carefully reviewed and selected from 139 submissions. They cover topics on post-quantum cryptography; interactive proofs; quantum cryptography; secret-sharing and applications; succinct proofs; identity-based encryption and functional encryption; attribute-based encryption and functional encryption; encryption; multi-party computation; protocols: key agreement and commitments; theory: sampling and friends; lattices; anonymity, verfiability and robustness; ORAM, OT and PIR; and theory.
Theory of Cryptography: 20th International Conference, TCC 2022, Chicago, IL, USA, November 7–10, 2022, Proceedings, Part II (Lecture Notes in Computer Science #13748)
by Eike Kiltz Vinod VaikuntanathanThe three-volume set LNCS 13747, LNCS 13748 and LNCS 13749 constitutes the refereed proceedings of the 20th International Conference on Theory of Cryptography, TCC 2022, held in Chicago, IL, USA, in November 2022. The total of 60 full papers presented in this three-volume set was carefully reviewed and selected from 139 submissions. They cover topics on post-quantum cryptography; interactive proofs; quantum cryptography; secret-sharing and applications; succinct proofs; identity-based encryption and functional encryption; attribute-based encryption and functional encryption; encryption; multi-party computation; protocols: key agreement and commitments; theory: sampling and friends; lattices; anonymity, verfiability and robustness; ORAM, OT and PIR; and theory.
Theory of Cryptography: 20th International Conference, TCC 2022, Chicago, IL, USA, November 7–10, 2022, Proceedings, Part III (Lecture Notes in Computer Science #13749)
by Eike Kiltz Vinod VaikuntanathanThe three-volume set LNCS 13747, LNCS 13748 and LNCS 13749 constitutes the refereed proceedings of the 20th International Conference on Theory of Cryptography, TCC 2022, held in Chicago, IL, USA, in November 2022. The total of 60 full papers presented in this three-volume set was carefully reviewed and selected from 139 submissions. They cover topics on post-quantum cryptography; interactive proofs; quantum cryptography; secret-sharing and applications; succinct proofs; identity-based encryption and functional encryption; attribute-based encryption and functional encryption; encryption; multi-party computation; protocols: key agreement and commitments; theory: sampling and friends; lattices; anonymity, verfiability and robustness; ORAM, OT and PIR; and theory.
Theory of Cryptography: 21st International Conference, TCC 2023, Taipei, Taiwan, November 29 – December 2, 2023, Proceedings, Part I (Lecture Notes in Computer Science #14369)
by Guy Rothblum Hoeteck WeeThe four-volume set LNCS 14369 until 14372 constitutes the refereed proceedings of the 21st International Conference on Theory of Cryptography, TCC 2023, held in Taipei, Taiwan, in November/December 2023. The total of 68 full papers presented in the proceedings was carefully reviewed and selected from 168 submissions. They focus on topics such as proofs and outsourcing; theoretical foundations; multi-party computation; encryption; secret sharing, PIR and memory checking; anonymity, surveillance and tampering; lower bounds; IOPs and succinctness; lattices; quantum cryptography; Byzantine agreement, consensus and composability.
Theory of Cryptography: 21st International Conference, TCC 2023, Taipei, Taiwan, November 29 – December 2, 2023, Proceedings, Part II (Lecture Notes in Computer Science #14370)
by Guy Rothblum Hoeteck WeeThe four-volume set LNCS 14369 until 14372 constitutes the refereed proceedings of the 21st International Conference on Theory of Cryptography, TCC 2023, held in Taipei, Taiwan, in November/December 2023. The total of 68 full papers presented in the proceedings was carefully reviewed and selected from 168 submissions. They focus on topics such as proofs and outsourcing; theoretical foundations; multi-party computation; encryption; secret sharing, PIR and memory checking; anonymity, surveillance and tampering; lower bounds; IOPs and succinctness; lattices; quantum cryptography; Byzantine agreement, consensus and composability.
Theory of Cryptography: 21st International Conference, TCC 2023, Taipei, Taiwan, November 29–December 2, 2023, Proceedings, Part III (Lecture Notes in Computer Science #14371)
by Guy Rothblum Hoeteck WeeThe four-volume set LNCS 14369 until 14372 constitutes the refereed proceedings of the 21st International Conference on Theory of Cryptography, TCC 2023, held in Taipei, Taiwan, in November/December 2023. The total of 68 full papers presented in the proceedings was carefully reviewed and selected from 168 submissions. They focus on topics such as proofs and outsourcing; theoretical foundations; multi-party computation; encryption; secret sharing, PIR and memory checking; anonymity, surveillance and tampering; lower bounds; IOPs and succinctness; lattices; quantum cryptography; Byzantine agreement, consensus and composability.
Theory of Cryptography: 21st International Conference, TCC 2023, Taipei, Taiwan, November 29–December 2, 2023, Proceedings, Part IV (Lecture Notes in Computer Science #14372)
by Guy Rothblum Hoeteck WeeThe four-volume set LNCS 14369 until 14372 constitutes the refereed proceedings of the 21st International Conference on Theory of Cryptography, TCC 2023, held in Taipei, Taiwan, in November/December 2023. The total of 68 full papers presented in the proceedings was carefully reviewed and selected from 168 submissions. They focus on topics such as proofs and outsourcing; theoretical foundations; multi-party computation; encryption; secret sharing, PIR and memory checking; anonymity, surveillance and tampering; lower bounds; IOPs and succinctness; lattices; quantum cryptography; Byzantine agreement, consensus and composability.
Theory of Cryptography: 22nd International Conference, TCC 2024, Milan, Italy, December 2–6, 2024, Proceedings, Part I (Lecture Notes in Computer Science #15364)
by Elette Boyle Mohammad MahmoodyThe four-volume set LNCS 15364-15367 constitutes the refereed proceedings of the 22nd International Conference on Theory of Cryptography, TCC 2024, held in Milan, Italy, in December 2024. The total of 68 full papers presented in the proceedings was carefully reviewed and selected from 172 submissions. They focus on topics such as: proofs; math and foundations; consensus and messaging; quantum; kolmogorov and OWFs; encryption; quantum and black-box separations; authentication and sequentiality; obfuscation and homomorphism; multi-party computation; information-theoretic cryptography; and secret sharing.
Theory of Cryptography: 22nd International Conference, TCC 2024, Milan, Italy, December 2–6, 2024, Proceedings, Part II (Lecture Notes in Computer Science #15365)
by Elette Boyle Mohammad MahmoodyThe four-volume set LNCS 15364-15367 constitutes the refereed proceedings of the 22nd International Conference on Theory of Cryptography, TCC 2024, held in Milan, Italy, in December 2024. The total of 68 full papers presented in the proceedings was carefully reviewed and selected from 172 submissions. They focus on topics such as: proofs; math and foundations; consensus and messaging; quantum; kolmogorov and OWFs; encryption; quantum and black-box separations; authentication and sequentiality; obfuscation and homomorphism; multi-party computation; information-theoretic cryptography; and secret sharing.
Theory of Cryptography: 22nd International Conference, TCC 2024, Milan, Italy, December 2–6, 2024, Proceedings, Part III (Lecture Notes in Computer Science #15366)
by Elette Boyle Mohammad MahmoodyThe four-volume set LNCS 15364-15367 constitutes the refereed proceedings of the 22nd International Conference on Theory of Cryptography, TCC 2024, held in Milan, Italy, in December 2024. The total of 68 full papers presented in the proceedings was carefully reviewed and selected from 172 submissions. They focus on topics such as: proofs; math and foundations; consensus and messaging; quantum; kolmogorov and OWFs; encryption; quantum and black-box separations; authentication and sequentiality; obfuscation and homomorphism; multi-party computation; information-theoretic cryptography; and secret sharing.
Theory of Cryptography: 22nd International Conference, TCC 2024, Milan, Italy, December 2–6, 2024, Proceedings, Part IV (Lecture Notes in Computer Science #15367)
by Elette Boyle Mohammad MahmoodyThe four-volume set LNCS 15364-15367 constitutes the refereed proceedings of the 22nd International Conference on Theory of Cryptography, TCC 2024, held in Milan, Italy, in December 2024. The total of 68 full papers presented in the proceedings was carefully reviewed and selected from 172 submissions. They focus on topics such as: proofs; math and foundations; consensus and messaging; quantum; kolmogorov and OWFs; encryption; quantum and black-box separations; authentication and sequentiality; obfuscation and homomorphism; multi-party computation; information-theoretic cryptography; and secret sharing.
Theory of Decision under Uncertainty
by Itzhak GilboaThis book describes the classical axiomatic theories of decision under uncertainty, as well as critiques thereof and alternative theories. It focuses on the meaning of probability, discussing some definitions and surveying their scope of applicability. The behavioral definition of subjective probability serves as a way to present the classical theories, culminating in Savage's theorem. The limitations of this result as a definition of probability lead to two directions - first, similar behavioral definitions of more general theories, such as non-additive probabilities and multiple priors, and second, cognitive derivations based on case-based techniques.
Theory of Digital Automata
by Oleksandr Petrov Mykola Karpinskyy Bohdan Borowik Valery LahnoThis book serves a dual purpose: firstly to combine the treatment of circuits and digital electronics, and secondly, to establish a strong connection with the contemporary world of digital systems. The need for this approach arises from the observation that introducing digital electronics through a course in traditional circuit analysis is fast becoming obsolete. Our world has gone digital. Automata theory helps with the design of digital circuits such as parts of computers, telephone systems and control systems. A complete perspective is emphasized, because even the most elegant computer architecture will not function without adequate supporting circuits. The focus is on explaining the real-world implementation of complete digital systems. In doing so, the reader is prepared to immediately begin design and implementation work. This work serves as a bridge to take readers from the theoretical world to the everyday design world where solutions must be complete to be successful.
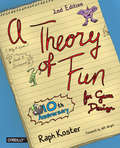
Theory of Fun for Game Design
by Raph KosterNow in full color, the 10th anniversary edition of this classic book takes you deep into the influences that underlie modern video games, and examines the elements they share with traditional games such as checkers. At the heart of his exploration, veteran game designer Raph Koster takes a close look at the concept of fun and why it’s the most vital element in any game.Why do some games become boring quickly, while others remain fun for years? How do games serve as fundamental and powerful learning tools? Whether you’re a game developer, dedicated gamer, or curious observer, this illustrated, fully updated edition helps you understand what drives this major cultural force, and inspires you to take it further.You’ll discover that:Games play into our innate ability to seek patterns and solve puzzlesMost successful games are built upon the same elementsSlightly more females than males now play gamesMany games still teach primitive survival skillsFictional dressing for modern games is more developed than the conceptual elementsTruly creative designers seldom use other games for inspirationGames are beginning to evolve beyond their prehistoric origins
Theory of Information and its Value
by Ruslan L. StratonovichThis English version of Ruslan L. Stratonovich’s Theory of Information (1975) builds on theory and provides methods, techniques, and concepts toward utilizing critical applications. Unifying theories of information, optimization, and statistical physics, the value of information theory has gained recognition in data science, machine learning, and artificial intelligence. With the emergence of a data-driven economy, progress in machine learning, artificial intelligence algorithms, and increased computational resources, the need for comprehending information is essential. This book is even more relevant today than when it was first published in 1975. It extends the classic work of R.L. Stratonovich, one of the original developers of the symmetrized version of stochastic calculus and filtering theory, to name just two topics.Each chapter begins with basic, fundamental ideas, supported by clear examples; the material then advances to great detail and depth. The reader is not required to be familiar with the more difficult and specific material. Rather, the treasure trove of examples of stochastic processes and problems makes this book accessible to a wide readership of researchers, postgraduates, and undergraduate students in mathematics, engineering, physics and computer science who are specializing in information theory, data analysis, or machine learning.
Theory of JIZAI Body: Towards Mastery Over the Extended Self
by Masahiko InamiThis book proposes a novel body image to bridge gap between self-transformation and preserving sense of self: the Jizai body. Automation and digitization have served to transform our lives. Digital transformation, for example, is rapidly changing the world every day, making life more convenient and comfortable. However, there is a worrying trend of removing the human element from human-centric systems as technologies and algorithms become more capable. Leaving humanity behind, especially its corporal components, will leave persons unable to feel a sense of self in their newfound comfort. Despite the allure of an automated life, it is doubtful that the authors will find happiness without a sense of control. Exploring the essence of what makes us human from a physiological and psychological standpoint, the authors present a new perspective on what constitutes a body in this era where the real physical world and virtual information world coexist. The authors present state-of-the-art research which seeks to free humanity from its physical constraints and allow free control of both the natural and extended body. The next step in human evolution starts here.
