- Table View
- List View
Inverse Problems and Large-Scale Computations
by Larisa Beilina Yury V. ShestopalovThis volume is a result of two international workshops, namely the Second Annual Workshop on Inverse Problems and the Workshop on Large-Scale Modeling, held jointly in Sunne, Sweden from May 1-6 2012. The subject of the inverse problems workshop was to present new analytical developments and new numerical methods for solutions of inverse problems. The objective of the large-scale modeling workshop was to identify large-scale problems arising in various fields of science and technology and covering all possible applications, with a particular focus on urgent problems in theoretical and applied electromagnetics. The workshops brought together scholars, professionals, mathematicians, and programmers and specialists working in large-scale modeling problems. The contributions in this volume are reflective of these themes and will be beneficial to researchers in this area.
Inverse Problems and Related Topics (Chapman & Hall/CRC Research Notes in Mathematics Series)
by G Nakamura S Saitoh J K Seo M YamamotoInverse problems arise in many disciplines and hold great importance to practical applications. However, sound new methods are needed to solve these problems. Over the past few years, Japanese and Korean mathematicians have obtained a number of very interesting and unique results in inverse problems.Inverse Problems and Related Topics compi
Inverse Problems and Related Topics: Shanghai, China, October 12–14, 2018 (Springer Proceedings in Mathematics & Statistics #310)
by Jin Cheng Masahiro Yamamoto Shuai LuThis volume contains 13 chapters, which are extended versions of the presentations at International Conference on Inverse Problems at Fudan University, Shanghai, China, October 12-14, 2018, in honor of Masahiro Yamamoto on the occasion of his 60th anniversary. The chapters are authored by world-renowned researchers and rising young talents, and are updated accounts of various aspects of the researches on inverse problems. The volume covers theories of inverse problems for partial differential equations, regularization methods, and related topics from control theory. This book addresses a wide audience of researchers and young post-docs and graduate students who are interested in mathematical sciences as well as mathematics.
Inverse Problems for Fractional Diffusion Equations (Industrial and Applied Mathematics)
by Durdimurod K. DurdievThis book discusses various inverse problems for the time-fractional diffusion equation, such as inverse coefficient problems (nonlinear problems) and inverse problems for determining the right-hand sides of equations and initial functions (linear problems). The study of inverse problems requires a comprehensive investigation of direct problems (such as representation formulas, a priori estimates and differential properties of the solution). This is particularly evident in nonlinear problems, where obtaining solvability theorems necessitates careful tracking of the exact dependence of the differential properties of the solution to the direct problem on the smoothness of the coefficients and other problem data. Therefore, a significant portion of the book is devoted to direct problems, such as initial problems (Cauchy problems) and initial-boundary value problems with various boundary conditions.
Inverse Problems for Integro-differential Operators (Applied Mathematical Sciences #222)
by Hongyu Liu Yi-Hsuan LinInverse problems lie at the core of scientific discovery, enabling us to determine causes from observed consequences. They are fundamental to both theoretical research and technological innovation, making them a central topic in the mathematical sciences. This book explores a cutting-edge area of inverse problems—those related to integro-differential operators, also known as nonlocal operators. Due to their unique theoretical properties and vast practical applications, nonlocal inverse problems have garnered significant interest in recent years, making this an ideal time for a dedicated research monograph. Focusing on nonlocality in space, this book provides a systematic study of both forward and inverse problems associated with integro-differential operators. It introduces key properties of forward problems—well-posedness, maximum principles, and unique continuation—before delving into inverse problems, including modeling, unique identifiability, stability analysis, and reconstruction methods. The discussion bridges mathematical theory with real-world applications, offering insights into pioneering contributions as well as recent advances by the authors and their collaborators. As an evolving field, nonlocal inverse problems present a wealth of open challenges and emerging applications. This book not only provides a comprehensive introduction but also aims to inspire future research with fresh perspectives and novel insights. It is an invaluable resource for graduate students and early-career researchers looking to enter the field, as well as a valuable reference for experienced mathematicians working in inverse problems and mathematical analysis.
Inverse Problems for Mechanical Systems: Methods, Simulations and Experiments (CISM International Centre for Mechanical Sciences #618)
by Antonino Morassi Alexandre KawanoThis book explores the crucial role of inverse problems across various fields of applied science and technology. By examining physical phenomena governed by mathematical physics, it addresses the challenge of determining unknown parameters and developing non-destructive methods for systems of solid and structural mechanics. It delves into the inherent mathematical complexities of inverse problems and presents innovative strategies for overcoming these issues. Aimed at doctoral students and researchers in civil and mechanical engineering, mathematical physics, and applied mathematics, the book provides a solid theoretical foundation and equips readers with the necessary mathematical and computational tools to tackle diverse inverse problems.
Inverse Problems for Partial Differential Equations
by Victor IsakovA comprehensive description of the current theoretical and numerical aspects of inverse problems in partial differential equations. Applications include recovery of inclusions from anomalies of their gravity fields, reconstruction of the interior of the human body from exterior electrical, ultrasonic, and magnetic measurement. By presenting the data in a readable and informative manner, the book introduces both scientific and engineering researchers as well as graduate students to the significant work done in this area in recent years, relating it to broader themes in mathematical analysis.
Inverse Problems with Applications in Science and Engineering
by Daniel LesnicDriven by the advancement of industrial mathematics and the need for impact case studies, Inverse Problems with Applications in Science and Engineering thoroughly examines the state-of-the-art of some representative classes of inverse and ill-posed problems for partial differential equations (PDEs). The natural practical applications of this examination arise in heat transfer, electrostatics, porous media, acoustics, fluid and solid mechanics – all of which are addressed in this text. Features: Covers all types of PDEs — namely, elliptic (Laplace’s, Helmholtz, modified Helmholtz, biharmonic and Stokes), parabolic (heat, convection, reaction and diffusion) and hyperbolic (wave) Excellent reference for post-graduates and researchers in mathematics, engineering and any other scientific discipline that deals with inverse problems Contains both theory and numerical algorithms for solving all types of inverse and ill-posed problems
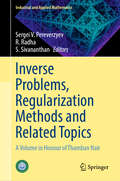
Inverse Problems, Regularization Methods and Related Topics: A Volume in Honour of Thamban Nair (Industrial and Applied Mathematics)
by Sergei V. Pereverzyev R. Radha S. SivananthanThis book features a thoughtfully curated collection of research contributions spanning regularization theory, integral equations, learning theory, and matrix and operator theory. These contributions were presented in honor of Prof. M. Thamban Nair on his 65th birthday during the International Conference on Analysis, Inverse Problems, and Applications, which took place at the IIT Madras in Chennai, India, from July 18–21, 2022. The book is a valuable resource for graduate students, engineers, scientists, and researchers looking to advance their work in the development of innovative regularization algorithms. It comprises 14 chapters contributed by esteemed experts and emerging researchers.
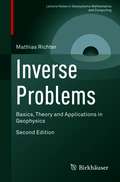
Inverse Problems: Basics, Theory and Applications in Geophysics (Lecture Notes in Geosystems Mathematics and Computing)
by Mathias RichterThis textbook is an introduction to the subject of inverse problems with an emphasis on practical solution methods and applications from geophysics. The treatment is mathematically rigorous, relying on calculus and linear algebra only; familiarity with more advanced mathematical theories like functional analysis is not required. Containing up-to-date methods, this book will provide readers with the tools necessary to compute regularized solutions of inverse problems. A variety of practical examples from geophysics are used to motivate the presentation of abstract mathematical ideas, thus assuring an accessible approach.Beginning with four examples of inverse problems, the opening chapter establishes core concepts, such as formalizing these problems as equations in vector spaces and addressing the key issue of ill-posedness. Chapter Two then moves on to the discretization of inverse problems, which is a prerequisite for solving them on computers. Readers will be well-prepared for the final chapters that present regularized solutions of inverse problems in finite-dimensional spaces, with Chapter Three covering linear problems and Chapter Four studying nonlinear problems. Model problems reflecting scenarios of practical interest in the geosciences, such as inverse gravimetry and full waveform inversion, are fully worked out throughout the book. They are used as test cases to illustrate all single steps of solving inverse problems, up to numerical computations. Five appendices include the mathematical foundations needed to fully understand the material.This second edition expands upon the first, particularly regarding its up-to-date treatment of nonlinear problems. Following the author’s approach, readers will understand the relevant theory and methodology needed to pursue more complex applications. Inverse Problems is ideal for graduate students and researchers interested in geophysics and geosciences.
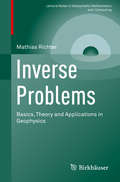
Inverse Problems: Basics, Theory and Applications in Geophysics (Lecture Notes in Geosystems Mathematics and Computing)
by Mathias RichterThe overall goal of the book is to provide access to the regularized solution of inverse problems relevant in geophysics without requiring more mathematical knowledge than is taught in undergraduate math courses for scientists and engineers. From abstract analysis only the concept of functions as vectors is needed. Function spaces are introduced informally in the course of the text, when needed. Additionally, a more detailed, but still condensed introduction is given in Appendix B.A second goal is to elaborate the single steps to be taken when solving an inverse problem: discretization, regularization and practical solution of the regularized optimization problem. These steps are shown in detail for model problems from the fields of inverse gravimetry and seismic tomography. The intended audience is mathematicians, physicists and engineers having a good working knowledge of linear algebra and analysis at the upper undergraduate level.
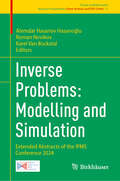
Inverse Problems: Extended Abstracts of the IPMS Conference 2024 (Trends in Mathematics #11)
by Alemdar Hasanov Hasanoğlu Karel Van Bockstal Roman NovikovThis volume presents the latest theoretical and experimental advancements in the field of inverse problems in recent years. It includes outstanding research results that reflect current theoretical and numerical aspects of inverse problems and their various applications. The volume is a collection of selected contributions from nearly three hundred invited presentations at the International Conference "Inverse Problems: Modelling and Simulation" (IPMS 2024) held from May 26 to June 1, 2024, in Malta. The topics covered in this volume are closely related to emerging deterministic and stochastic models in the fields of medical imaging, biology, geophysics, radar, computer science, communication theory, signal processing, visualization, engineering, and economics. The contributions in this volume reflect a broad range of problems in the theory and applications of inverse problems that are useful for mathematicians, physicists, engineers, and researchers working with inverse problems.
Inverse Scattering Problems and Their Application to Nonlinear Integrable Equations (Chapman & Hall/CRC Monographs and Research Notes in Mathematics)
by Pham Loi VuInverse Scattering Problems and Their Application to Nonlinear Integrable Equations is devoted to inverse scattering problems (ISPs) for differential equations and their application to nonlinear evolution equations (NLEEs). The book is suitable for anyone who has a mathematical background and interest in functional analysis, partial differential equations, equations of mathematical physics, and functions of a complex variable. This book is intended for a wide community working with inverse scattering problems and their applications; in particular, there is a traditional community in mathematical physics. In this monograph, the problems are solved step-by-step, and detailed proofs are given for the problems to make the topics more accessible for students who are approaching them for the first time. Features • The unique solvability of ISPs are proved. The scattering data of the considered inverse scattering problems (ISPs) are described completely. • Solving the associated initial value problem or initial-boundary value problem for the nonlinear evolution equations (NLEEs) is carried out step-by-step. Namely, the NLEE can be written as the compatibility condition of two linear equations. The unknown boundary values are calculated with the help of the Lax (generalized) equation, and then the time-dependent scattering data (SD) are constructed from the initial and boundary conditions. • The potentials are recovered uniquely in terms of time-dependent SD, and the solution of the NLEEs is expressed uniquely in terms of the found solutions of the ISP. • Since the considered ISPs are solved well, then the SPs generated by two linear equations constitute the inverse scattering method (ISM). The application of the ISM to solving the NLEEs is consistent and is effectively embedded in the schema of the ISM.
Inverse Scattering Problems and Their Application to Nonlinear Integrable Equations (Chapman & Hall/CRC Monographs and Research Notes in Mathematics)
by Pham Loi VuInverse Scattering Problems and Their Applications to Nonlinear Integrable Equations, Second Edition is devoted to inverse scattering problems (ISPs) for differential equations and their applications to nonlinear evolution equations (NLEEs). The book is suitable for anyone who has a mathematical background and interest in functional analysis, differential equations, and equations of mathematical physics. This book is intended for a wide community working with ISPs and their applications. There is an especially strong traditional community in mathematical physics. In this monograph, the problems are presented step-by-step, and detailed proofs are given for considered problems to make the topics more accessible for students who are approaching them for the first time. New to the Second Edition All new chapter dealing with the Bäcklund transformations between a common solution of both linear equations in the Lax pair and the solution of the associated IBVP for NLEEs on the half-line Updated references and concluding remarks Features Solving the direct and ISP, then solving the associated initial value problem (IVP) or initial-boundary value problem (IBVP) for NLEEs are carried out step-by-step. The unknown boundary values are calculated with the help of the Lax (generalized) equations, then the time-dependent scattering data (SD) are expressed in terms of preassigned initial and boundary conditions. Thereby, the potential functions are recovered uniquely in terms of the given initial and calculated boundary conditions. The unique solvability of the ISP is proved and the SD of the scattering problem is described completely. The considered ISPs are well-solved. The ISPs are set up appropriately for constructing the Bӓckhund transformations (BTs) for solutions of associated IBVPs or IVPs for NLEEs. The procedure for finding a BT for the IBVP for NLEEs on the half-line differs from the one used for obtaining a BT for non-linear differential equations defined in the whole space. The interrelations between the ISPs and the constructed BTs are established to become new powerful unified transformations (UTs) for solving IBVPs or IVPs for NLEEs, that can be used in different areas of physics and mechanics. The application of the UTs is consistent and efficiently embedded in the scheme of the associated ISP.
Inverse Spectral Problems for Linear Differential Operators and Their Applications (Analytical Methods and Special Functions)
by V A YurkoAims to construct the inverse problem theory for ordinary non-self-adjoint differential operators of arbitary order on the half-line and on a finite interval. The book consists of two parts: in the first part the author presents a general inverse problem of recovering differential equations with integrable coefficients when the behaviour of the spe
Inverse Spectral and Scattering Theory: An Introduction (SpringerBriefs in Mathematical Physics #38)
by Hiroshi IsozakiThe aim of this book is to provide basic knowledge of the inverse problems arising in various areas in mathematics, physics, engineering, and medical science. These practical problems boil down to the mathematical question in which one tries to recover the operator (coefficients) or the domain (manifolds) from spectral data. The characteristic properties of the operators in question are often reduced to those of Schrödinger operators. We start from the 1-dimensional theory to observe the main features of inverse spectral problems and then proceed to multi-dimensions. The first milestone is the Borg–Levinson theorem in the inverse Dirichlet problem in a bounded domain elucidating basic motivation of the inverse problem as well as the difference between 1-dimension and multi-dimension. The main theme is the inverse scattering, in which the spectral data is Heisenberg’s S-matrix defined through the observation of the asymptotic behavior at infinity of solutions. Significant progress has been made in the past 30 years by using the Faddeev–Green function or the complex geometrical optics solution by Sylvester and Uhlmann, which made it possible to reconstruct the potential from the S-matrix of one fixed energy. One can also prove the equivalence of the knowledge of S-matrix and that of the Dirichlet-to-Neumann map for boundary value problems in bounded domains. We apply this idea also to the Dirac equation, the Maxwell equation, and discrete Schrödinger operators on perturbed lattices. Our final topic is the boundary control method introduced by Belishev and Kurylev, which is for the moment the only systematic method for the reconstruction of the Riemannian metric from the boundary observation, which we apply to the inverse scattering on non-compact manifolds. We stress that this book focuses on the lucid exposition of these problems and mathematical backgrounds by explaining the basic knowledge of functional analysis and spectral theory, omitting the technical details in order to make the book accessible to graduate students as an introduction to partial differential equations (PDEs) and functional analysis.
Invertibility and Singularity for Bounded Linear Operators
by Robin HarteThis introduction to functional analysis focuses on the types of singularity that prevent an operator from being invertible. The presentation is based on the open mapping theorem, Hahn-Banach theorem, dual space construction, enlargement of normed space, and Liouville's theorem. Suitable for advanced undergraduate and graduate courses in functional analysis, this volume is also a valuable resource for researchers in Fredholm theory, Banach algebras, and multiparameter spectral theory. The treatment develops the theory of open and almost open operators between incomplete spaces. It builds the enlargement of a normed space and of a bounded operator and sets up an elementary algebraic framework for Fredholm theory. The approach extends from the definition of a normed space to the fringe of modern multiparameter spectral theory and concludes with a discussion of the varieties of joint spectrum. This edition contains a brief new Prologue by author Robin Harte as well as his lengthy new Epilogue, "Residual Quotients and the Taylor Spectrum."Dover republication of the edition published by Marcel Dekker, Inc., New York, 1988.
Investigations 3 in Number, Data, and Space, Student Activity Book [Grade 2]
by Scott ForesmanNIMAC-sourced textbook
Investigations 3 in Number, Data, and Space, Student Activity Book [Grade 3]
by Scott ForesmanNIMAC-sourced textbook
Investigations 3 in Number, Data, and Space, Student Activity Book [Grade K]
by Scott ForesmanNIMAC-sourced textbook
Investigations in Number Data and Space (2nd edition)
by Pearson Scott ForesmanA student activity book for factors, multiples, arrays, shape of the data, Multiple Towers and Division Stories, Size, Shape, and Symmetry, Landmarks and Large Numbers, Fraction Cards and Decimal Squares, Moving Between Solids and Silhouettes, Penny Jars and Plant Growth.
Investigations in Number, Data, and Space Student Activity Book
by Economopoulos RussellNIMAC-sourced textbook
Investigations in Number, Data, and Space Student Activity Book
by Economopoulos RussellNIMAC-sourced textbook
