- Table View
- List View
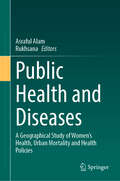
Public Health and Diseases: A Geographical Study of Women's Health, Urban Mortality and Health Policies
by Rukhsana Asraful AlamThis book provides a multi-disciplinary exploration of gender, public health, and disease with a focus on urban areas impacted by climate change. In three sections, global case studies are provided that analyze health risk management strategies in vulnerable populations containing high rates of mortality and disease morbidity. The sections are broadly divided along the themes, of women's health and gendered health challenges, demographic health issues such as aging populations, and the impacts of urbanization on health and the strategies to improve public health in urban areas such as green space projects. The book will be useful resource for students and researchers of health geography and public health, as well as public health practitioners and policymakers.
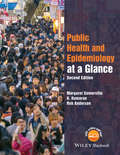
Public Health and Epidemiology at a Glance
by Margaret Somerville K. Kumaran Rob AndersonThis brand new title in the market-leading at a Glance series provides a highly-illustrated, visual introduction to the key concepts of population-level disease prevention. Accessible, double-page spreads help you understand and appreciate the determinants of health which impact on healthcare services and their effectiveness. Public Health and Epidemiology at a Glance features high-yield information on all the topics covered at medical school, including: Measurement of population health Epidemiological concepts of cause and association, surveillance, and risk Use of epidemiology in clinical decision-making Epidemiology of major health problems such as cardiovascular disease and cancer Health promotion Basics of health economics Basics of health policy, needs assessment, and evaluation Also featuring self-assessment questions to help test learning, this new title will provide an invaluable resource for medical and healthcare students, junior doctors, and those preparing for a career in public health.
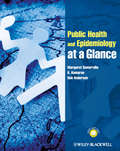
Public Health and Epidemiology at a Glance (At a Glance #72)
by Margaret Somerville K. Kumaran Rob AndersonThis brand new title in the market-leading at a Glance series provides a highly-illustrated, visual introduction to the key concepts of population-level disease prevention. Accessible, double-page spreads help you understand and appreciate the determinants of health which impact on healthcare services and their effectiveness. Public Health and Epidemiology at a Glance features high-yield information on all the topics covered at medical school, including: Measurement of population health Epidemiological concepts of cause and association, surveillance, and risk Use of epidemiology in clinical decision-making Epidemiology of major health problems such as cardiovascular disease and cancer Health promotion Basics of health economics Basics of health policy, needs assessment, and evaluation Also featuring self-assessment questions to help test learning, this new title will provide an invaluable resource for medical and healthcare students, junior doctors, and those preparing for a career in public health.
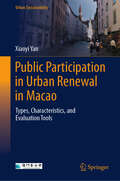
Public Participation in Urban Renewal in Macao: Types, Characteristics, and Evaluation Tools (Urban Sustainability)
by Xiaoyi YanThis book analyses of public participation in the different development stages of urban renewal in Macao. Three types of participation are summarized from practice, analyzed their characteristics. And then develops a framework and a set of standards of participation quality evaluation that are applicable to Macao. Through a case study of public consultation meeting on Macao Urban Renewal Legal System, the participation quality of government-led public participation was evaluated. Finally, the applicability of the evaluation framework and standards was discussed. This book enriches the existing theories, and it provides new experience and the cases of public participation in urban renewal. Public participation in a new local context with multicultural and strong social connections was discussed. It builds the systems theoretical foundation on this field in Macao. It is a useful book for graduate students and the researcher in the academic field of urban renewal or urban governance to understand the public participation in urban renewal theory. This book can provide references for the government, associations, and private individuals to initiate and carry out public participation activities. It could provide decision-makers and researchers in Macao a reference for the quality evaluation of public participation.
Public Policy Analytics: Code and Context for Data Science in Government (Chapman & Hall/CRC Data Science Series)
by Ken SteifPublic Policy Analytics: Code & Context for Data Science in Government teaches readers how to address complex public policy problems with data and analytics using reproducible methods in R. Each of the eight chapters provides a detailed case study, showing readers: how to develop exploratory indicators; understand ‘spatial process’ and develop spatial analytics; how to develop ‘useful’ predictive analytics; how to convey these outputs to non-technical decision-makers through the medium of data visualization; and why, ultimately, data science and ‘Planning’ are one and the same. A graduate-level introduction to data science, this book will appeal to researchers and data scientists at the intersection of data analytics and public policy, as well as readers who wish to understand how algorithms will affect the future of government.

Public Relations: A Values-Driven Approach
by Charles Marsh David W. GuthAn introduction to Public Relations that focuses on ethical, productive relationships with strategic constituencies Public Relations: A Values-Driven Approach introduces students to public relations, defined as the management of relationships between an organization and the publics important to its success. Authors David Guth and Charles Marsh outline the profession’s common issues, trends, and techniques, and help students to place the profession within the context of its role in the conduct of a civil society. In order to help students understand the contemporary state of the field, the Sixth Edition offers the most up-to-date statistics, the latest research, and the most current examples of public relations practice.
Public Systems Modeling: Methods for Identifying and Evaluating Alternative Plans and Policies (International Series in Operations Research & Management Science #318)
by Daniel P. LoucksThis is an open access book discusses readers to various methods of modeling plans and policies that address public sector issues and problems. Written for public policy and social sciences students at the upper undergraduate and graduate level, as well as public sector decision-makers, it demonstrates and compares the development and use of various deterministic and probabilistic optimization and simulation modeling methods for analyzing planning and management issues. These modeling tools offer a means of identifying and evaluating alternative plans and policies based on their physical, economic, environmental, and social impacts. Learning how to develop and use the mathematical modeling tools introduced in this book will give students useful skills when in positions of having to make informed public policy recommendations or decisions.
Pulling Rabbits Out of Hats: Using Mathematical Modeling in the Material, Biophysical, Fluid Mechanical, and Chemical Sciences (Advances in Biochemistry and Biophysics)
by Bonni J. Dichone David WollkindPulling Rabbits Out of Hats: Using Mathematical Modeling in the Material, Biophysical, Fluid Mechanical, and Chemical Sciences focuses on those assumptions made during applied mathematical modeling in which the phenomenological data and the model predictions are self-consistent. This comprehensive reference demonstrates how to employ a variety of mathematical techniques to quantify a number of problems from the material, biophysical, fluid mechanical, and chemical sciences. In doing so, methodology of modelling, analysis, and result generation are all covered. Key Features: Includes examples on such cases as solidification of alloys, chemically-driven convection of dissociating gases, temperature-dependent predator-prey mite systems, multi-layer and two-phase fluid phenomena, viral-target cell interactions, diffusive and gravitational instabilities, and chemical, material science, optical, and ecological Turing patterns. Aims to make the process of quantification of scientific phenomena transparent. Is a hybrid semi-autobiographical account of research results and a monograph on pattern formation. This book is for everyone with an interest in how both scientific contributions are made and mathematical modelling is developed from first principles in STEM fields. For errata, please visit the author's website.
Pulse
by Douglas W. HubbardThe ultimate guide to mining the Internet for real-time assessment of trends and dataShowing how the Internet can be an incredible tool for businesses and others to measure trends in real time, Pulse describes tools for inexpensive and real time measurement methodologies businesses can start using right away. This timely book also puts this emerging science in perspective and explains how this new measurement instrument will profoundly change decision making in business and government.Shows how the Internet can be used as an incredibly powerful measurement toolReveals how to mine the Internet to measure and forecast business progressWritten by leading expert in business analytics and performance managementPulse reveals how the Internet is evolving into a tool for measuring and forecasting trends in society, the economy, public opinion and even public health and security. It is an absolutely essential book for every business leader to turn a powerful, underutilized tool to its complete potential.
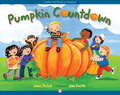
Pumpkin Countdown
by Joan Holub Jan SmithIn this rhyming picture book, a classroom of children goes on a field trip to the pumpkin patch, where they count everything in sight. The book is perfect for the fall season, and an extra-fun way to teach children to count backward from twenty.This is a fixed-format ebook, which preserves the design and layout of the original print book.
Punishing Places: The Geography of Mass Imprisonment
by Jessica T. SimesPunishing Places applies a unique spatial analysis to mass incarceration in the United States. It demonstrates that our highest imprisonment rates are now in small cities, suburbs, and rural areas. Jessica Simes argues that mass incarceration should be conceptualized as one of the legacies of U.S. racial residential segregation, but that a focus on large cities has diverted vital scholarly and policy attention away from communities affected most by mass incarceration today. This book presents novel measures for estimating the community-level effects of incarceration using spatial, quantitative, and qualitative methods. This analysis has broad and urgent implications for policy reforms aimed at ameliorating the community effects of mass incarceration and promoting alternatives to the carceral system.
Pupil Reactions in Response to Human Mental Activity (Behaviormetrics: Quantitative Approaches to Human Behavior #6)
by Minoru Nakayama Yasutaka ShimizuThis book focuses on a development for assessing mental changes using eye pupil reactions, namely extracting emotional change from the response to evaluate the viewer's interest in visual information. The pupil of the eye reacts to both brightness and emotional state, including interest, enjoyment, and mental workload. Because pupillary change is a biological signal, various artifacts influence measurements of eye images. Technical procedures are required to extract mental activities from pupillary changes, and they are summarized here step by step, although some procedures contain earlier techniques such as analog video processing. This study examines the possibility of estimating the viewer's interest and enjoyment of viewing movies by measuring the dynamic pupillary changes, blinking, and subjective interest responses. In evaluation of pupil size, there was a significant difference in pupil size between the higher and the lower shot for the degree of subject interest response in each kind of movies. The first part of the book shows a pupil reaction model for brightness changes to extract mental activities. Pupil reactions were observed for various visual stimuli in brightness changes. With regard to the characteristics of pupillary changes, a model with a three-layer neural network was developed and the performance was evaluated. Characteristics of pupil reactions during model development are summarized here. The second part examines the possibility of estimating the viewer's interest and enjoyment of television programs by measuring dynamic pupillary changes, blinking, and subjective interest responses. The final part describes a development of estimation model of pupil size for blink artifact. The model development was able to estimate pupillary changes and pupil size while the viewer was blinking and was applied to pupillary changes in viewing television programs.
Pure Metric Geometry (SpringerBriefs in Mathematics)
by Anton PetruninThis book serves as an introductory asset for learning metric geometry by delivering an in-depth examination of key constructions and providing an analysis of universal spaces, injective spaces, the Gromov-Hausdorff convergence, and ultralimits. This book illustrates basic examples of domestic affairs of metric spaces, this includes Alexandrov geometry, geometric group theory, metric-measure spaces and optimal transport.Researchers in metric geometry will find this book appealing and helpful, in addition to graduate students in mathematics, and advanced undergraduate students in need of an introduction to metric geometry. Any previous knowledge of classical geometry, differential geometry, topology, and real analysis will be useful in understanding the presented topics.
Puritan Boston and Quaker Philadelphia
by E. Digby BaltzellBased on the biographies of some three hundred people in each city, this book shows how such distinguished Boston families as the Adamses, Cabots, Lowells, and Peabodys have produced many generations of men and women who have made major contributions to the intellectual, educational, and political life of their state and nation. At the same time, comparable Philadelphia families such as the Biddles, Cadwaladers, Ingersolls, and Drexels have contributed far fewer leaders to their state and nation. From the days of Benjamin Franklin and Stephen Girard down to the present, what leadership there has been in Philadelphia has largely been provided by self-made men, often, like Franklin, born outside Pennsylvania.Baltzell traces the differences in class authority and leadership in these two cites to the contrasting values of the Puritan founders of the Bay Colony and the Quaker founders of the City of Brotherly Love. While Puritans placed great value on the calling or devotion to one's chosen vocation, Quakers have always placed more emphasis on being a good person than on being a good judge or statesman. Puritan Boston and Quaker Philadelphia presents a provocative view of two contrasting upper classes and also reflects the author's larger concern with the conflicting values of hierarchy and egalitarianism in American history.

Purity, Spectra and Localisation
by Mike PrestThe central aim of this book is to understand modules and the categories they form through associated structures and dimensions, which reflect the complexity of these, and similar, categories. The structures and dimensions considered arise particularly through the application of model-theoretic and functor-category ideas and methods. Purity and associated notions are central, localization is an ever-present theme and various types of spectrum play organizing roles. This book presents a unified, coherent account of material which is often presented from very different viewpoints and clarifies the relationships between these various approaches.
Pursuing Excellence in Mathematics Education
by Christine Keitel-Kreidt Edward SilverChapters in this book recognize the more than forty years of sustained and distinguished lifetime achievement in mathematics education research and development of Jeremy Kilpatrick. Including contributions from a variety of skilled mathematics educators, this text honors Jeremy Kilpatrick, reflecting on his groundbreaking papers, book chapters, and books - many of which are now standard references in the literature - on mathematical problem solving, the history of mathematics education, mathematical ability and proficiency, curriculum change and its history, global perspectives on mathematics education, and mathematics assessment. Many chapters also offer substantial contributions of their own on important themes, including mathematical problem solving, mathematics curriculum, the role of theory in mathematics education, the democratization of mathematics, and international perspectives on the professional field of mathematics education.
Putnam and Beyond
by Titu Andreescu Răzvan GelcaThis book takes the reader on a journey through the world of college mathematics, focusing on some of the most important concepts and results in the theories of polynomials, linear algebra, real analysis, differential equations, coordinate geometry, trigonometry, elementary number theory, combinatorics, and probability. Preliminary material provides an overview of common methods of proof: argument by contradiction, mathematical induction, pigeonhole principle, ordered sets, and invariants. Each chapter systematically presents a single subject within which problems are clustered in each section according to the specific topic. The exposition is driven by nearly 1300 problems and examples chosen from numerous sources from around the world; many original contributions come from the authors. The source, author, and historical background are cited whenever possible. Complete solutions to all problems are given at the end of the book. This second edition includes new sections on quad ratic polynomials, curves in the plane, quadratic fields, combinatorics of numbers, and graph theory, and added problems or theoretical expansion of sections on polynomials, matrices, abstract algebra, limits of sequences and functions, derivatives and their applications, Stokes' theorem, analytical geometry, combinatorial geometry, and counting strategies. Using the W. L. Putnam Mathematical Competition for undergraduates as an inspiring symbol to build an appropriate math background for graduate studies in pure or applied mathematics, the reader is eased into transitioning from problem-solving at the high school level to the university and beyond, that is, to mathematical research. This work may be used as a study guide for the Putnam exam, as a text for many different problem-solving courses, and as a source of problems for standard courses in undergraduate mathematics. Putnam and Beyond is organized for independent study by undergraduate and gradu ate students, as well as teachers and researchers in the physical sciences who wish to expand their mathematical horizons.
Putting Auction Theory to Work
by Paul MilgromProviding a comprehensive introduction to modern auction theory and its important new applications, this book is written by a leading economic theorist whose suggestions guided the creation of the new spectrum auction designs. Aimed at graduate students and professionals in economics, the volume provides the most up-to-date analysis of traditional theories of "optimal auctions" as well as newer theories of multi-unit auctions and package auctions, and shows by example how these theories are used. It explores the limitations of prominent older designs, such as the Vickrey auction design, and evaluates the practical responses to those limitations. Paul Milgrom is the Leonard and Shirley Ely Professor of Humanities and Sciences and Professor of Economics, Stanford University. He is the author of more than sixty articles and co-author of the influential textbook, Economics, Organization and Management (Prentice Hall, 1992). Professor Milgrom is a pioneer in the economic theory of auctions and co-designer of the simultaneous, multiple round auction that the FCC adopted for selling radio spectrum licenses. Visit the author's website for instructor resources.
Putting Ourselves Back in the Equation: Why Physicists Are Studying Human Consciousness and AI to Unravel the Mysteries of the Universe
by George MusserDistant galaxies, dark matter, black holes – elusive, incomprehensible and inhospitable – these are the building blocks of modern physics. But where do we fit in this picture? For centuries, we have separated mind from matter. While physicists have pursued a theory of &‘everything&’ with single-minded purpose, the matter of the mind, of human consciousness, has been conveniently sidestepped and ignored – consigned to priests, philosophers and poets. With the ambition of Stephen Hawking, Carlo Rovelli and Brian Cox, Putting Ourselves Back in the Equation sets out a bold new vision for theoretical physics, unrestricted by sleek equations and neat formulations. Combining cutting-edge neuroscience with the latest in quantum mechanics, acclaimed writer Musser offers a new interpretation of human consciousness. From bizarre cognitive phenomena, like lucid dreaming and self-taught synaesthesia, to the latest technological developments in AI, Musser asks: what can physics teach us about what it means to be human?
Puzzle Me Twice: 70 Simple Puzzles (Alex Bellos Puzzle Books #0)
by Alex Bellos“A brilliant collection of puzzles. Never has getting the answer wrong felt so good!”—G. T. Karber, author of Murdle Most people get these puzzles wrong. Will you beat the odds? From mathy mind-benders to eye-fooling illusions, here are 70 perplexing puzzles of every kind. But they all have one key thing in common—a wrong answer that seems so right! In Puzzle Me Twice, you’ll have to think—and think again—to overrule your first instinct and uncover the truth. For example: If a hen and a half lays an egg and a half in a day and a half, how many eggs do half a dozen hens lay in half a dozen days?* Bestselling author Alex Bellos wrangles math and physics, logic and wordplay, optical illusions, card games, and more to tie readers’ brains in pleasurable knots. It’s a merry tour of the many ways our reasoning can go wrong—and how we can be more fool-proof in the future. Puzzle on! *Four times as many hens, over four times as many days, lay 16 times as many eggs: 1.5 × 16 = 24 eggs.
Puzzle and Proof: A Decade of Problems from the Utah Math Olympiad (AK Peters/CRC Recreational Mathematics Series)
by Samuel Dittmer Hiram Golze Grant Molnar Caleb StanfordPuzzle and Proof: A Decade of Problems from the Utah Math Olympiad is a compilation of the problems and solutions for the first 10 years of the Utah Math Olympiad. The problems are challenging but should be understandable at a high school level. Besides putting all problems in one place (70 in total), which have not previously appeared in print, the book provides additional inspiration for many of the problems and will contain the first published solutions for 10 problems that were originally published on the contest flyer. The book will be a fantastic resource for anyone who enjoys mathematical and/or logic puzzles or is interested in studying for mathematics competitions.Features 70 carefully designed, high-quality high-school level math proof problems, with full solutions Detailed pictures and diagrams throughout to aid understanding Suitable for anyone with high school-level mathematics skills with an interest in furthering their understanding, or just enjoying the puzzles Solutions in the back of the book, sorting the problems by difficulty and topic.
Puzzles 101: A PuzzleMasters Challenge
by Nobuyuki YoshigaharaThis latest collection of puzzles from the internationally acclaimed puzzlemaster Nob Yoshigahara covers a wide variety of puzzles from physical to visual, conceptual to mathematical. Solutions are provided in a separate section, which will help novices get on the right track, and will give seasoned aficionados a chance to check their work.
Puzzles, Paradoxes, and Problem Solving: An Introduction to Mathematical Thinking
by Marilyn A. Reba Douglas R. ShierA Classroom-Tested, Alternative Approach to Teaching Math for Liberal Arts Puzzles, Paradoxes, and Problem Solving: An Introduction to Mathematical Thinking uses puzzles and paradoxes to introduce basic principles of mathematical thought. The text is designed for students in liberal arts mathematics courses. Decision-making situations that progress
Puzzling Adventures: Tales of Strategy, Logic, and Mathematical Skill
by Dennis E. ShashaSafecracking, bullying, marital infidelity and gambling have never before been explored with the mathematical acuity and whimsy of Puzzling Adventures. Collected and enhanced from Dennis Shasha's popular Scientific American column, here are thirty-five of the most innovative and emotive mathematical puzzles ever to appear in its pages. Edgy, challenging and representing the ultimate in recreational mathematical games, Puzzling Adventures dares the reader to work out the logic underlying venture fund investments, escape a Minotaur, catch a polar bear, play power politics, work out if a witness is lying, spy on contraband traders and verify DNA. An encrypted set of stories and commentary float above the puzzles. They need decrypting to discover their hints. The hints lead to a surprise-if the reader can work them out...