- Table View
- List View
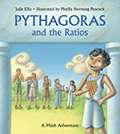
Pythagoras and the Ratios: A Math Adventure (Charlesbridge Math Adventures Ser.)
by Julie EllisPythagorus figures out mathematical ratios while measuring musical instruments.
Pythagoras' Revenge: A Mathematical Mystery
by Arturo SangalliThe celebrated mathematician and philosopher Pythagoras left no writings. But what if he had and the manuscript was never found? Where would it be located? And what information would it reveal? These questions are the inspiration for the mathematical mystery novel Pythagoras' Revenge. Suspenseful and instructive, Pythagoras' Revenge weaves fact, fiction, mathematics, computer science, and ancient history into a surprising and sophisticated thriller. The intrigue begins when Jule Davidson, a young American mathematician who trolls the internet for difficult math riddles and stumbles upon a neo-Pythagorean sect searching for the promised reincarnation of Pythagoras. Across the ocean, Elmer Galway, a professor of classical history at Oxford, discovers an Arabic manuscript hinting at the existence of an ancient scroll--possibly left by Pythagoras himself. Unknown to one another, Jule and Elmer each have information that the other requires and, as they race to solve the philosophical and mathematical puzzles set before them, their paths ultimately collide. Set in 1998 with flashbacks to classical Greece, Pythagoras' Revenge investigates the confrontation between opposing views of mathematics and reality, and explores ideas from both early and cutting-edge mathematics. From academic Oxford to suburban Chicago and historic Rome, Pythagoras' Revenge is a sophisticated thriller that will grip readers from beginning to surprising end.
Pythagoras: His Life, Teaching, and Influence
by Steven Rendall Christoph RiedwegOne of the most important mathematical theorems is named after Pythagoras of Samos, but this semi-mythical Greek sage has more to offer than formulas. He is said to have discovered the numerical nature of the basic consonances and transposed the musical proportions to the cosmos, postulating a "harmony of the spheres." He may have coined the words "cosmos" and "philosophy." He is also believed to have taught the doctrine of transmigration of souls and therefore to have advised a vegetarian diet.Ancient legends have Pythagoras conversing with dogs, bears, and bulls. A distinctly Pythagorean way of life, including detailed ritual regulations, was observed by his disciples, who were organized as a secret society. Later, Pythagorean and Platonic teachings became fused. In this Platonized form, Pythagoreanism has remained influential through medieval Christianity and the Renaissance down to the present.Christoph Riedweg's book is an engaging introduction to the fundamental contributions of Pythagoras to the establishment of European culture. To penetrate the intricate maze of lore and ascertain what history can tell us about the philosopher, Riedweg not only examines the written record but also considers Pythagoras within the cultural, intellectual, and spiritual context of his times. The result is a vivid overview of the life and teachings of a crucial Greek thinker and his most important followers.
Pythagorean Fuzzy Sets: Theory and Applications
by Harish GargThis book presents a collection of recent research on topics related to Pythagorean fuzzy set, dealing with dynamic and complex decision-making problems. It discusses a wide range of theoretical and practical information to the latest research on Pythagorean fuzzy sets, allowing readers to gain an extensive understanding of both fundamentals and applications. It aims at solving various decision-making problems such as medical diagnosis, pattern recognition, construction problems, technology selection, and more, under the Pythagorean fuzzy environment, making it of much value to students, researchers, and professionals associated with the field.
Pythagorean Triangles (Dover Books on Mathematics)
by Waclaw SierpinskiThe Pythagorean Theorem is one of the fundamental theorems of elementary geometry, and Pythagorean triangles — right triangles whose sides are natural numbers — have been studied by mathematicians since antiquity. In this classic text, a brilliant Polish mathematician explores the intriguing mathematical relationships in such triangles.Starting with "primitive" Pythagorean triangles, the text examines triangles with sides less than 100, triangles with two sides that are successive numbers, divisibility of one of the sides by 3 or by 5, the values of the sides of triangles, triangles with the same arm or the same hypotenuse, triangles with the same perimeter, and triangles with the same area. Additional topics include the radii of circles inscribed in Pythagorean triangles, triangles in which one or more sides are squares, triangles with natural sides and natural areas, triangles in which the hypotenuse and the sum of the arms are squares, representation of triangles with the help of the points of a plane, right triangles whose sides are reciprocals of natural numbers, and cuboids with edges and diagonals expressed by natural numbers.
Python Machine Learning
by Sebastian RaschkaUnlock deeper insights into Machine Leaning with this vital guide to cutting-edge predictive analytics About This Book * Leverage Python's most powerful open-source libraries for deep learning, data wrangling, and data visualization * Learn effective strategies and best practices to improve and optimize machine learning systems and algorithms * Ask - and answer - tough questions of your data with robust statistical models, built for a range of datasets Who This Book Is For If you want to find out how to use Python to start answering critical questions of your data, pick up Python Machine Learning - whether you want to get started from scratch or want to extend your data science knowledge, this is an essential and unmissable resource. What You Will Learn * Explore how to use different machine learning models to ask different questions of your data * Learn how to build neural networks using Pylearn 2 and Theano * Find out how to write clean and elegant Python code that will optimize the strength of your algorithms * Discover how to embed your machine learning model in a web application for increased accessibility * Predict continuous target outcomes using regression analysis * Uncover hidden patterns and structures in data with clustering * Organize data using effective pre-processing techniques * Get to grips with sentiment analysis to delve deeper into textual and social media data In Detail Machine learning and predictive analytics are transforming the way businesses and other organizations operate. Being able to understand trends and patterns in complex data is critical to success, becoming one of the key strategies for unlocking growth in a challenging contemporary marketplace. Python can help you deliver key insights into your data - its unique capabilities as a language let you build sophisticated algorithms and statistical models that can reveal new perspectives and answer key questions that are vital for success. Python Machine Learning gives you access to the world of predictive analytics and demonstrates why Python is one of the world's leading data science languages. If you want to ask better questions of data, or need to improve and extend the capabilities of your machine learning systems, this practical data science book is invaluable. Covering a wide range of powerful Python libraries, including scikit-learn, Theano, and Pylearn2, and featuring guidance and tips on everything from sentiment analysis to neural networks, you'll soon be able to answer some of the most important questions facing you and your organization. Style and approach Python Machine Learning connects the fundamental theoretical principles behind machine learning to their practical application in a way that focuses you on asking and answering the right questions. It walks you through the key elements of Python and its powerful machine learning libraries, while demonstrating how to get to grips with a range of statistical models.
Python Machine Learning By Example: Unlock machine learning best practices with real-world use cases
by Yuxi (Hayden) LiuAuthor Yuxi (Hayden) Liu teaches machine learning from the fundamentals to building NLP transformers and multimodal models with best practice tips and real-world examples using PyTorch, TensorFlow, scikit-learn, and pandasKey FeaturesDiscover new and updated content on NLP transformers, PyTorch, and computer vision modelingIncludes a dedicated chapter on best practices and additional best practice tips throughout the book to improve your ML solutionsImplement ML models, such as neural networks and linear and logistic regression, from scratchPurchase of the print or Kindle book includes a free PDF copyBook DescriptionThe fourth edition of Python Machine Learning By Example is a comprehensive guide for beginners and experienced machine learning practitioners who want to learn more advanced techniques, such as multimodal modeling. Written by experienced machine learning author and ex-Google machine learning engineer Yuxi (Hayden) Liu, this edition emphasizes best practices, providing invaluable insights for machine learning engineers, data scientists, and analysts. Explore advanced techniques, including two new chapters on natural language processing transformers with BERT and GPT, and multimodal computer vision models with PyTorch and Hugging Face. You’ll learn key modeling techniques using practical examples, such as predicting stock prices and creating an image search engine. This hands-on machine learning book navigates through complex challenges, bridging the gap between theoretical understanding and practical application. Elevate your machine learning and deep learning expertise, tackle intricate problems, and unlock the potential of advanced techniques in machine learning with this authoritative guide.What you will learnFollow machine learning best practices throughout data preparation and model developmentBuild and improve image classifiers using convolutional neural networks (CNNs) and transfer learningDevelop and fine-tune neural networks using TensorFlow and PyTorchAnalyze sequence data and make predictions using recurrent neural networks (RNNs), transformers, and CLIPBuild classifiers using support vector machines (SVMs) and boost performance with PCAAvoid overfitting using regularization, feature selection, and moreWho this book is forThis expanded fourth edition is ideal for data scientists, ML engineers, analysts, and students with Python programming knowledge. The real-world examples, best practices, and code prepare anyone undertaking their first serious ML project.
Python Machine Learning Cookbook: Over 100 recipes to progress from smart data analytics to deep learning using real-world datasets, 2nd Edition
by Prateek Joshi Giuseppe CiaburroDiscover powerful ways to effectively solve real-world machine learning problems using key libraries including scikit-learn, TensorFlow, and PyTorch Key Features Learn and implement machine learning algorithms in a variety of real-life scenarios Cover a range of tasks catering to supervised, unsupervised and reinforcement learning techniques Find easy-to-follow code solutions for tackling common and not-so-common challenges Book Description This eagerly anticipated second edition of the popular Python Machine Learning Cookbook will enable you to adopt a fresh approach to dealing with real-world machine learning and deep learning tasks. With the help of over 100 recipes, you will learn to build powerful machine learning applications using modern libraries from the Python ecosystem. The book will also guide you on how to implement various machine learning algorithms for classification, clustering, and recommendation engines, using a recipe-based approach. With emphasis on practical solutions, dedicated sections in the book will help you to apply supervised and unsupervised learning techniques to real-world problems. Toward the concluding chapters, you will get to grips with recipes that teach you advanced techniques including reinforcement learning, deep neural networks, and automated machine learning. By the end of this book, you will be equipped with the skills you need to apply machine learning techniques and leverage the full capabilities of the Python ecosystem through real-world examples. What you will learn Use predictive modeling and apply it to real-world problems Explore data visualization techniques to interact with your data Learn how to build a recommendation engine Understand how to interact with text data and build models to analyze it Work with speech data and recognize spoken words using Hidden Markov Models Get well versed with reinforcement learning, automated ML, and transfer learning Work with image data and build systems for image recognition and biometric face recognition Use deep neural networks to build an optical character recognition system Who this book is for This book is for data scientists, machine learning developers, deep learning enthusiasts and Python programmers who want to solve real-world challenges using machine-learning techniques and algorithms. If you are facing challenges at work and want ready-to-use code solutions to cover key tasks in machine learning and the deep learning domain, then this book is what you need. Familiarity with Python programming and machine learning concepts will be useful.
Python Parallel Programming Cookbook: Over 70 recipes to solve challenges in multithreading and distributed system with Python 3, 2nd Edition
by Giancarlo ZacconeImplement effective programming techniques in Python to build scalable software that saves time and memory Key Features Design distributed computing systems and massive computational tasks coherently Learn practical recipes with concise explanations that address development pain points encountered while coding parallel programs Understand how to host your parallelized applications on the cloud Book Description Nowadays, it has become extremely important for programmers to understand the link between the software and the parallel nature of their hardware so that their programs run efficiently on computer architectures. Applications based on parallel programming are fast, robust, and easily scalable. This updated edition features cutting-edge techniques for building effective concurrent applications in Python 3.7. The book introduces parallel programming architectures and covers the fundamental recipes for thread-based and process-based parallelism. You'll learn about mutex, semaphores, locks, queues exploiting the threading, and multiprocessing modules, all of which are basic tools to build parallel applications. Recipes on MPI programming will help you to synchronize processes using the fundamental message passing techniques with mpi4py. Furthermore, you'll get to grips with asynchronous programming and how to use the power of the GPU with PyCUDA and PyOpenCL frameworks. Finally, you'll explore how to design distributed computing systems with Celery and architect Python apps on the cloud using PythonAnywhere, Docker, and serverless applications. By the end of this book, you will be confident in building concurrent and high-performing applications in Python. What you will learn Synchronize multiple threads and processes to manage parallel tasks Use message passing techniques to establish communication between processes to build parallel applications Program your own GPU cards to address complex problems Manage computing entities to execute distributed computational task Write efficient programs by adopting the event-driven programming model Explore cloud technology with Django and Google App Engine Apply parallel programming techniques that can lead to performance improvements Who this book is for The Python Parallel Programming Cookbook is for software developers who are well-versed with Python and want to use parallel programming techniques to write powerful and efficient code. This book will help you master the basics and the advanced of parallel computing.
Python Programming for Data Analysis
by José UnpingcoThis textbook grew out of notes for the ECE143 Programming for Data Analysis class that the author has been teaching at University of California, San Diego, which is a requirement for both graduate and undergraduate degrees in Machine Learning and Data Science. This book is ideal for readers with some Python programming experience. The book covers key language concepts that must be understood to program effectively, especially for data analysis applications. Certain low-level language features are discussed in detail, especially Python memory management and data structures. Using Python effectively means taking advantage of its vast ecosystem. The book discusses Python package management and how to use third-party modules as well as how to structure your own Python modules. The section on object-oriented programming explains features of the language that facilitate common programming patterns.After developing the key Python language features, the book moves on to third-party modules that are foundational for effective data analysis, starting with Numpy. The book develops key Numpy concepts and discusses internal Numpy array data structures and memory usage. Then, the author moves onto Pandas and details its many features for data processing and alignment. Because strong visualizations are important for communicating data analysis, key modules such as Matplotlib are developed in detail, along with web-based options such as Bokeh, Holoviews, Altair, and Plotly.The text is sprinkled with many tricks-of-the-trade that help avoid common pitfalls. The author explains the internal logic embodied in the Python language so that readers can get into the Python mindset and make better design choices in their codes, which is especially helpful for newcomers to both Python and data analysis. To get the most out of this book, open a Python interpreter and type along with the many code samples.
Python and R for the Modern Data Scientist
by Rick J. Scavetta Boyan AngelovSuccess in data science depends on the flexible and appropriate use of tools. That includes Python and R, two of the foundational programming languages in the field. This book guides data scientists from the Python and R communities along the path to becoming bilingual. By recognizing the strengths of both languages, you'll discover new ways to accomplish data science tasks and expand your skill set.Authors Rick Scavetta and Boyan Angelov explain the parallel structures of these languages and highlight where each one excels, whether it's their linguistic features or the powers of their open source ecosystems. You'll learn how to use Python and R together in real-world settings and broaden your job opportunities as a bilingual data scientist.Learn Python and R from the perspective of your current languageUnderstand the strengths and weaknesses of each languageIdentify use cases where one language is better suited than the otherUnderstand the modern open source ecosystem available for both, including packages, frameworks, and workflowsLearn how to integrate R and Python in a single workflowFollow a case study that demonstrates ways to use these languages together
Python for Accounting and Finance: An Integrative Approach to Using Python for Research
by Sunil KumarThis book is a comprehensive guide to the application of Python in accounting, finance, and other business disciplines. This book is more than a Python tutorial; it is an integrative approach to using Python for practical research in these fields. The book begins with an introduction to Python and its key libraries. It then covers real-world applications of Python, covering data acquisition, cleaning, exploratory data analysis, visualization, and advanced topics like natural language processing, machine learning, predictive analytics, and deep learning. What sets this book apart is its unique blend of theoretical knowledge and real-world examples, supplemented with ready-to-use code. It doesn't stop at the syntax; it shows how to apply Python to tackle actual analytical problems. The book uses case studies to illustrate how Python can enhance traditional research methods in accounting and finance, not only allowing the reader to gain a firm understanding of Pythonprogramming but also equipping them with the skills to apply Python to accounting, finance, and broader business research. Whether you are a PhD student, a professor, an industry professional, or a financial researcher, this book provides the key to unlocking the full potential of Python in research.
Python for Bioinformatics (Chapman & Hall/CRC Mathematical and Computational Biology)
by Sebastian BassiIn today's data driven biology, programming knowledge is essential in turning ideas into testable hypothesis. Based on the author’s extensive experience, Python for Bioinformatics, Second Edition helps biologists get to grips with the basics of software development. Requiring no prior knowledge of programming-related concepts, the book focuses on the easy-to-use, yet powerful, Python computer language. This new edition is updated throughout to Python 3 and is designed not just to help scientists master the basics, but to do more in less time and in a reproducible way. New developments added in this edition include NoSQL databases, the Anaconda Python distribution, graphical libraries like Bokeh, and the use of Github for collaborative development.
Python for Excel Users: A Beginner's Guide
by David Wang Chi-Chun ChouIntroduction: Elevate Your Analytics with PythonIn today’s data-driven world, the ability to efficiently analyze and interpret information is more crucial than ever, especially in the business sector. Python for Excel Users: A Beginner’s Guide is tailored for business students and professionals who are proficient in Microsoft Excel but are ready to embark on their Python journey. As a powerful and versatile programming language, Python has become indispensable in data analysis. This book bridges the gap between Excel and Python by providing parallel exercises that demonstrate how Python can amplify business analytics tasks with unmatched efficiency and flexibility.Through its side-by-side comparisons, interactive Python exercises, and a "teachable moment" approach, this guide offers a unique and intuitive learning experience. By translating familiar Excel tasks into Python’s dynamic and versatile ecosystem, you’ll not only enhance your data analysis skills but also gain confidence in programming.Why Python?Did you know that Python powers cutting-edge technologies like ChatGPT? Indeed, Python forms the foundation of many machine learning algorithms, including large language models (LLMs). Python is more than a programming language; it’s a tool for understanding and shaping the digital world. Despite its advanced capabilities, Python’s simple, readable syntax makes it accessible to everyone – from professional software developers to citizen developers like you. Dubbed the "language of the people," Python is revolutionizing how we approach problem-solving and automation in the modern world.Becoming Tomorrow’s Tech- Savvy LeadersThe leaders of tomorrow are not just visionaries – they are innovators who harness the power of technology to drive change and inspire others. This book guides you through different scenarios to help you understand the connections between business questions and analytics steps we are taking.As business students embracing Python, you’re positioning yourselves as future-ready leaders equipped to navigate and excel in the complexities of modern business.Welcome to a journey that will elevate your analytics, expand your technological fluency, and transform you into a tech-savvy leader of the future.
Python for Excel: A Modern Environment For Automation And Data Analysis
by Felix ZumsteinWhile Excel remains ubiquitous in the business world, recent Microsoft feedback forums are full of requests to include Python as an Excel scripting language. In fact, it's the top feature requested. What makes this combination so compelling? In this hands-on guide, Felix Zumstein--creator of xlwings, a popular open source package for automating Excel with Python--shows experienced Excel users how to integrate these two worlds efficiently.Excel has added quite a few new capabilities over the past couple of years, but its automation language, VBA, stopped evolving a long time ago. Many Excel power users have already adopted Python for daily automation tasks. This guide gets you started.Use Python without extensive programming knowledgeGet started with modern tools, including Jupyter notebooks and Visual Studio codeUse pandas to acquire, clean, and analyze data and replace typical Excel calculationsAutomate tedious tasks like consolidation of Excel workbooks and production of Excel reportsUse xlwings to build interactive Excel tools that use Python as a calculation engineConnect Excel to databases and CSV files and fetch data from the internet using Python codeUse Python as a single tool to replace VBA, Power Query, and Power Pivot
Python for Marketing Research and Analytics
by Chris Chapman Elea McDonnell Feit Jason S. SchwarzThis book provides an introduction to quantitative marketing with Python. The book presents a hands-on approach to using Python for real marketing questions, organized by key topic areas. Following the Python scientific computing movement toward reproducible research, the book presents all analyses in Colab notebooks, which integrate code, figures, tables, and annotation in a single file. The code notebooks for each chapter may be copied, adapted, and reused in one's own analyses. The book also introduces the usage of machine learning predictive models using the Python sklearn package in the context of marketing research. This book is designed for three groups of readers: experienced marketing researchers who wish to learn to program in Python, coming from tools and languages such as R, SAS, or SPSS; analysts or students who already program in Python and wish to learn about marketing applications; and undergraduate or graduate marketing students with little or no programming background. It presumes only an introductory level of familiarity with formal statistics and contains a minimum of mathematics.
Python for Mathematics (Chapman & Hall/CRC The Python Series)
by Vincent KnightPython for Mathematics introduces readers to effective methods for doing mathematics using the Python programming language. Most programming texts introduce readers to the building blocks of programming and build up to using more sophisticated tools for a specific purpose, like doing particular mathematical tasks. This is akin to teaching someone how to forge metal so as to make a nail, and then slowly working up to using sophisticated power tools so as to actually build something. This book does things in a different way, by first getting readers to begin using and understanding the tools that are going to be helpful to them as mathematicians, and only then moving onto the granular details. In this way, the practical application of the tools can aid in the understanding of the theory.Features· Complete with engaging, practical exercises· Many useful and detailed coding examples· Suitable for undergraduates in mathematics, and other quantitative sciences· Empowers readers to design and create their own Python tools.
Python for Probability, Statistics, and Machine Learning
by José UnpingcoThis book covers thekey ideas that link probability, statistics, and machine learning illustratedusing Python modules in these areas. The entire text, including all thefigures and numerical results, is reproducible using the Python codes and theirassociated Jupyter/IPython notebooks, which are provided as supplementarydownloads. The author develops key intuitions in machine learning by workingmeaningful examples using multiple analytical methods and Python codes, therebyconnecting theoretical concepts to concrete implementations. Modern Pythonmodules like Pandas, Sympy, and Scikit-learn are applied to simulate andvisualize important machine learning concepts like the bias/variance trade-off,cross-validation, and regularization. Many abstract mathematical ideas, such asconvergence in probability theory, are developed and illustrated with numericalexamples. This book is suitable for anyone with an undergraduate-levelexposure to probability, statistics, or machine learning and with rudimentaryknowledge of Python programming.
Python for Probability, Statistics, and Machine Learning
by José UnpingcoThis textbook, fully updated to feature Python version 3.7, covers the key ideas that link probability, statistics, and machine learning illustrated using Python modules. The entire text, including all the figures and numerical results, is reproducible using the Python codes and their associated Jupyter/IPython notebooks, which are provided as supplementary downloads. The author develops key intuitions in machine learning by working meaningful examples using multiple analytical methods and Python codes, thereby connecting theoretical concepts to concrete implementations. The update features full coverage of Web-based scientific visualization with Bokeh Jupyter Hub; Fisher Exact, Cohen’s D and Rank-Sum Tests; Local Regression, Spline, and Additive Methods; and Survival Analysis, Stochastic Gradient Trees, and Neural Networks and Deep Learning. Modern Python modules like Pandas, Sympy, and Scikit-learn are applied to simulate and visualize important machine learning concepts like the bias/variance trade-off, cross-validation, and regularization. Many abstract mathematical ideas, such as convergence in probability theory, are developed and illustrated with numerical examples. This book is suitable for classes in probability, statistics, or machine learning and requires only rudimentary knowledge of Python programming.
Python for Probability, Statistics, and Machine Learning
by José UnpingcoThis book, fully updated for Python version 3.6+, covers the key ideas that link probability, statistics, and machine learning illustrated using Python modules in these areas. All the figures and numerical results are reproducible using the Python codes provided. The author develops key intuitions in machine learning by working meaningful examples using multiple analytical methods and Python codes, thereby connecting theoretical concepts to concrete implementations. Detailed proofs for certain important results are also provided. Modern Python modules like Pandas, Sympy, Scikit-learn, Tensorflow, and Keras are applied to simulate and visualize important machine learning concepts like the bias/variance trade-off, cross-validation, and regularization. Many abstract mathematical ideas, such as convergence in probability theory, are developed and illustrated with numerical examples. This updated edition now includes the Fisher Exact Test and the Mann-Whitney-Wilcoxon Test. A new section on survival analysis has been included as well as substantial development of Generalized Linear Models. The new deep learning section for image processing includes an in-depth discussion of gradient descent methods that underpin all deep learning algorithms. As with the prior edition, there are new and updated *Programming Tips* that the illustrate effective Python modules and methods for scientific programming and machine learning. There are 445 run-able code blocks with corresponding outputs that have been tested for accuracy. Over 158 graphical visualizations (almost all generated using Python) illustrate the concepts that are developed both in code and in mathematics. We also discuss and use key Python modules such as Numpy, Scikit-learn, Sympy, Scipy, Lifelines, CvxPy, Theano, Matplotlib, Pandas, Tensorflow, Statsmodels, and Keras.This book is suitable for anyone with an undergraduate-level exposure to probability, statistics, or machine learning and with rudimentary knowledge of Python programming.
Python for Water and Environment (Innovations in Sustainable Technologies and Computing)
by Anil Kumar Manabendra SahariaThis textbook delves into the practical applications of surface and groundwater hydrology, as well as the environment. The Part I, "Practical Python for a Water and Environment Professional," guides readers through setting up a scientific computing environment and conducting exploratory data analysis and visualization using reproducible workflows. The Part II, "Statistical Modeling in Hydrology," covers regression models, time series analysis, and common hypothesis testing. The Part III, "Surface and Subsurface Water," illustrates the use of Python in understanding key concepts related to seepage, groundwater, and surface water flows. Lastly, the Part IV, "Environmental Applications," demonstrates the application of Python in the study of various contaminant transport phenomena.
Python und SMath in der Wärmetechnik: Wärmeübertragung, Sonnenenergie, Gasmischungen u. Verbrennungsrechnung
by Heinz SchmidDieses Buch verbindet Ingenieurstheorie, Thermodynamik und Wärmeübertragung mit Softwareanwendungen wie SMath, MathCAD und Python. Es ist kein klassisches Lehrbuch, behandelt jedoch die grundlegenden Gleichungen und kommentiert Python-Programme. Zudem wird die Entwicklung von Wärmeaustauscher-Programmen mit Python-GUIs thematisiert, unter Nutzung leistungsstarker Bibliotheken. Querverweise zu aktuellen globalen Problemen wie dem Klimawandel und Lösungen, z.B. die Nutzung von grünem Wasserstoff, werden ebenfalls aufgezeigt.
Q Methodology
by Bruce F. Mckeown Dan B. ThomasDirect, well-organized, and easy to follow, Q Methodology, Second Edition, by Bruce McKeown and Dan B. Thomas, reviews the philosophical foundations of subjective communicability (concourse theory), operant subjectivity, and quantum-theoretical aspects of Q as relevant to the social and behavioral sciences. The authors discuss data-gathering techniques (communication concourses, Q samples, and Q sorting), statistical techniques (correlation and factor analysis and the important calculation of factor scores), and strategies for conducting small person-sample research along Q methodological lines.
Q# Pocket Guide: Instant Help for Q# Developers
by Mariia MykhailovaReady to build quantum computing applications using Q# and the Microsoft Quantum Development Kit? This is the book for you. Q# is a domain-specific language for expressing quantum algorithms that combines familiar "classical" language constructs with quantum-specific ones. Ideal for any developer familiar with (or willing to learn) the basics of quantum computing and looking to get started with quantum programming, this pocket guide quickly helps you find syntax and usage information for unfamiliar aspects of Q#.You'll explore the quantum software development lifecycle from implementing the program to running it on quantum simulators to testing and debugging it. You'll learn to use the tools provided by Microsoft's Quantum Development Kit for each step of the process.You'll explore:Q# language details, including data types, statements, and operatorsGuidelines for organizing Q# code and invoking it from different environmentsInformation on simulators and tools in the Microsoft Quantum Development KitAdvice on testing and debugging tools and techniques for quantum programs

QCA with R: A Comprehensive Resource
by Adrian DuşaThis book is a comprehensive guide to qualitative comparative analysis (QCA) using R. Using Boolean algebra to implement principles of comparison used by scholars engaged in the qualitative study of macro social phenomena, QCA acts as a bridge between the quantitative and the qualitative traditions. The QCA package for R, created by the author, facilitates QCA within a graphical user interface. This book provides the most current information on the latest version of the QCA package, which combines written commands with a cross-platform interface. Beginning with a brief introduction to the concept of QCA, this book moves from theory to calibration, from analysis to factorization, and hits on all the key areas of QCA in between. Chapters one through three are introductory, familiarizing the reader with R, the QCA package, and elementary set theory. The next few chapters introduce important applications of the package beginning with calibration, analysis of necessity, analysis of sufficiency, parameters of fit, negation and factorization, and the construction of Venn diagrams. The book concludes with extensions to the classical package, including temporal applications and panel data. Providing a practical introduction to an increasingly important research tool for the social sciences, this book will be indispensable for students, scholars, and practitioners interested in conducting qualitative research in political science, sociology, business and management, and evaluation studies. <P><P><i>Advisory: Bookshare has learned that this book offers only partial accessibility. We have kept it in the collection because it is useful for some of our members. Benetech is actively working on projects to improve accessibility issues such as these.</i>