- Table View
- List View
Quantum Spin and Representations of the Poincaré Group, Part II: With a Focus on Physics and Operator Theory (Synthesis Lectures on Engineering, Science, and Technology)
by Horst R. BeyerThis book discusses how relativistic quantum field theories must transform under strongly continuous unitary representations of the Poincaré group. The focus is on the construction of the representations that provide the basis for the formulation of current relativistic quantum field theories of scalar fields, the Dirac field, and the electromagnetic field. Such construction is tied to the use of the methods of operator theory that also provide the basis for the formulation of quantum mechanics, up to the interpretation of the measurement process. In addition, since representation spaces of primary interest in quantum theory are infinite dimensional, the use of these methods is essential. Consequently, the book also calculates the generators of relevant strongly continuous one-parameter groups that are associated with the representations and, where appropriate, the corresponding spectrum. Part II of Quantum Spin and Representations of the Poincaré Group specifically addresses: construction of a double cover of the restricted Lorentz Group; Weyl spinors; Weyl representation of SL(2, C); an extension to a strongly continuous representation of a semi-direct product of R^4 and SL(2, C); Dirac spinors; Dirac fields; Dirac equation; Spin 1 representations of SL(2, C); Maxwell fields; and Maxwell's equations.
Quantum Statistics of Dense Gases and Nonideal Plasmas
by Werner Ebeling Vladimir E. Fortov Vladimir FilinovThe aim of this book is the pedagogical exploration of the basic principles of quantum-statistical thermodynamics as applied to various states of matter - ranging from rare gases to astrophysical matter with high-energy density. The reader will learn in this work that thermodynamics and quantum statistics are still the concepts on which even the most advanced research is operating - despite of a flood of modern concepts, classical entities like temperature, pressure, energy and entropy are shown to remain fundamental. The physics of gases, plasmas and high-energy density matter is still a growing field and even though solids and liquids dominate our daily life, more than 99 percent of the visible Universe is in the state of gases and plasmas and the overwhelming part of matter exists at extreme conditions connected with very large energy densities, such as in the interior of stars. This text, combining material from lectures and advanced seminars given by the authors over many decades, is a must-have introduction and reference for both newcomers and seasoned researchers alike.

Quantum Stochastics
by Mou-Hsiung ChangThe classical probability theory initiated by Kolmogorov and its quantum counterpart, pioneered by von Neumann, were created at about the same time in the 1930s, but development of the quantum theory has trailed far behind. Although highly appealing, the quantum theory has a steep learning curve, requiring tools from both probability and analysis and a facility for combining the two viewpoints. This book is a systematic, self-contained account of the core of quantum probability and quantum stochastic processes for graduate students and researchers. The only assumed background is knowledge of the basic theory of Hilbert spaces, bounded linear operators, and classical Markov processes. From there, the book introduces additional tools from analysis, and then builds the quantum probability framework needed to support applications to quantum control and quantum information and communication. These include quantum noise, quantum stochastic calculus, stochastic quantum differential equations, quantum Markov semigroups and processes, and large-time asymptotic behavior of quantum Markov semigroups.
Quantum Technology for Economists (Contributions to Economics)
by Isaiah Hull Göran Wendin Or Sattath Eleni DiamantiThis book offers an introduction to quantum technology that is specifically tailored to economists, students of economics, and professionals in the financial and payments industries. The book reviews quantum speedups that have been identified for algorithms used to solve and estimate economic models, including function approximation, linear systems analysis, graphical modeling, Monte Carlo simulation, matrix inversion, principal component analysis, linear regression, dynamic programming, interpolation, numerical differentiation, and true random number generation. It also provides an overview of quantum financial technology and its potential applications in economics and finance. Written by an interdisciplinary team with backgrounds in economics, computer science, and physics, this book offers a valuable guide for researchers and practitioners who want to understand the implications and possibilities of quantum technology for the field of economics.
Quantum Theory and Local Causality (SpringerBriefs in Philosophy)
by Gábor Hofer-Szabó Péter VecsernyésThis book summarizes the results of research the authors have pursued in the past years on the problem of implementing Bell's notion of local causality in local physical theories and relating it to other important concepts and principles in the foundations of physics such as the Common Cause Principle, Bell's inequalities, the EPR (Einstein-Podolsky-Rosen) scenario, and various other locality and causality concepts. The book is intended for philosophers of science with an interest in the formal background of sciences, philosophers of physics and physicists working in foundation of physics.
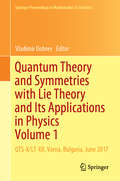
Quantum Theory and Symmetries with Lie Theory and Its Applications in Physics Volume 1: QTS-X/LT-XII, Varna, Bulgaria, June 2017 (Springer Proceedings in Mathematics & Statistics #263)
by Vladimir DobrevThis book is the first volume of proceedings from the joint conference X International Symposium “Quantum Theory and Symmetries” (QTS-X) and XII International Workshop “Lie Theory and Its Applications in Physics” (LT-XII), held on 19–25 June 2017 in Varna, Bulgaria. The QTS series was founded on the core principle that symmetries underlie all descriptions of quantum systems. It has since evolved into a symposium at the forefront of theoretical and mathematical physics. The LT series covers the whole field of Lie theory in its widest sense, together with its applications in many areas of physics. As an interface between mathematics and physics, the workshop serves as a meeting place for mathematicians and theoretical and mathematical physicists. In dividing the material between the two volumes, the Editor has sought to select papers that are more oriented toward mathematics for the first volume, and those focusing more on physics for the second. However, this division is relative, since many papers are equally suitable for either volume. The topics addressed in this volume represent the latest trends in the fields covered by the joint conferences: representation theory, integrability, entanglement, quantum groups, number theory, conformal geometry, quantum affine superalgebras, noncommutative geometry. Further, they present various mathematical results: on minuscule modules, symmetry breaking operators, Kashiwara crystals, meta-conformal invariance, the superintegrable Zernike system.
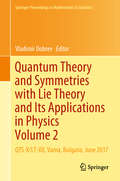
Quantum Theory and Symmetries with Lie Theory and Its Applications in Physics Volume 2: QTS-X/LT-XII, Varna, Bulgaria, June 2017 (Springer Proceedings in Mathematics & Statistics #255)
by Vladimir DobrevThis book is the second volume of the proceedings of the joint conference X. International Symposium “Quantum Theory and Symmetries” (QTS-X) and XII. International Workshop “Lie Theory and Its Applications in Physics” (LT-XII), 19–25 June 2017, Varna, Bulgaria.The QTS series started around the core concept that symmetries underlie all descriptions of quantum systems. It has since evolved into a symposium on the frontiers of theoretical and mathematical physics. The LT series covers the whole field of Lie Theory in its widest sense together with its applications in many facets of physics. As an interface between mathematics and physics the workshop serves as a meeting place for mathematicians and theoretical and mathematical physicists.In the division of the material between the two volumes, the Editor has tried to select for the first and second volumes papers that are more oriented toward mathematics and physics, respectively. However, this division is relative since many papers could have been placed in either volume. The topics covered in this volume represent the most modern trends in the fields of the joint conferences: symmetries in string theories, conformal field theory, holography, gravity theories and cosmology, gauge theories, foundations of quantum theory, nonrelativistic and classical theories.
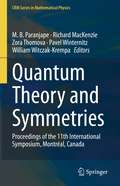
Quantum Theory and Symmetries: Proceedings of the 11th International Symposium, Montreal, Canada (CRM Series in Mathematical Physics)
by Pavel Winternitz M. B. Paranjape Richard MacKenzie Zora Thomova William Witczak-KrempaThis volume of the CRM Conference Series is based on a carefully refereed selection of contributions presented at the "11th International Symposium on Quantum Theory and Symmetries", held in Montréal, Canada from July 1-5, 2019. The main objective of the meeting was to share and make accessible new research and recent results in several branches of Theoretical and Mathematical Physics, including Algebraic Methods, Condensed Matter Physics, Cosmology and Gravitation, Integrability, Non-perturbative Quantum Field Theory, Particle Physics, Quantum Computing and Quantum Information Theory, and String/ADS-CFT. There was also a special session in honour of Decio Levi. The volume is divided into sections corresponding to the sessions held during the symposium, allowing the reader to appreciate both the homogeneity and the diversity of mathematical tools that have been applied in these subject areas. Several of the plenary speakers, who are internationally recognized experts in their fields, have contributed reviews of the main topics to complement the original contributions.
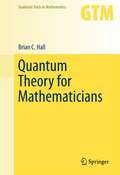
Quantum Theory for Mathematicians
by Brian C. HallAlthough ideas from quantum physics play an important role in many parts of modern mathematics, there are few books about quantum mechanics aimed at mathematicians. This book introduces the main ideas of quantum mechanics in language familiar to mathematicians. Readers with little prior exposure to physics will enjoy the book's conversational tone as they delve into such topics as the Hilbert space approach to quantum theory; the Schrödinger equation in one space dimension; the Spectral Theorem for bounded and unbounded self-adjoint operators; the Stone-von Neumann Theorem; the Wentzel-Kramers-Brillouin approximation; the role of Lie groups and Lie algebras in quantum mechanics; and the path-integral approach to quantum mechanics. The numerous exercises at the end of each chapter make the book suitable for both graduate courses and independent study. Most of the text is accessible to graduate students in mathematics who have had a first course in real analysis, covering the basics of L2 spaces and Hilbert spaces. The final chapters introduce readers who are familiar with the theory of manifolds to more advanced topics, including geometric quantization.
Quantum Theory of High-Energy Ion-Atom Collisions
by Dzevad BelkicOne of the Top Selling Physics Books according to YBP Library ServicesSuitable for graduate students, experienced researchers, and experts, this book provides a state-of-the-art review of the non-relativistic theory of high-energy ion-atom collisions. Special attention is paid to four-body interactive dynamics through the most important theoretical
Quantum Tools for Macroscopic Systems (Synthesis Lectures on Mathematics & Statistics)
by Fabio Bagarello Francesco Oliveri Francesco GarganoThis book describes how complex systems from a variety of fields can be modeled using quantum mechanical ideas; from biology and ecology, to sociology and decision-making. Quantum mechanics is traditionally associated with microscopic systems; however, quantum concepts have also been successfully applied to a wide range of macroscopic systems both within and outside physics. The mathematical basis of these models is covered in detail, providing a self-contained and consistent approach. This book provides unique insight into the dynamics of these macroscopic systems and opens new interdisciplinary research frontiers. The authors present an essential resource for researchers in applied mathematics or theoretical physics who are interested in applying quantum mechanics to complex systems in the social, biological or ecological sciences.Describes how complex systems from a variety of fields can be modeled using quantum mechanical ideasProvides insight into the dynamics of macroscopic systems and opens new interdisciplinary research frontiersIntroduces quantum tools needed for the analysis of the dynamical behavior of macroscopic systems
Quantum Trajectories (Atoms, Molecules, and Clusters)
by Pratim Kumar ChattarajThe application of quantum mechanics to many-particle systems has been an active area of research in recent years as researchers have looked for ways to tackle difficult problems in this area. The quantum trajectory method provides an efficient computational technique for solving both stationary and time-evolving states, encompassing a large area o
Quantum Transport
by Yuli V. Nazarov Yaroslav M. BlanterQuantum transport is a diverse field, sometimes combining seemingly contradicting concepts - quantum and classical, conduction and insulating - within a single nanodevice. Quantum transport is an essential and challenging part of nanoscience, and understanding its concepts and methods is vital to the successful fabrication of devices at the nanoscale. This textbook, first published in 2009, is a comprehensive introduction to the rapidly developing field of quantum transport. The authors present the comprehensive theoretical background, and explore the groundbreaking experiments that laid the foundations of the field. Ideal for graduate students, each section contains control questions and exercises to check readers' understanding of the topics covered. Its broad scope and in-depth analysis of selected topics will appeal to researchers and professionals working in nanoscience.
Quantum Transport in Interacting Nanojunctions: A Density Matrix Approach (Lecture Notes in Physics #1024)
by Andrea Donarini Milena GrifoniThis book serves as an introduction to the growing field of quantum many-body transport in interacting nanojunctions. It delves into a theoretical approach based on a general density-matrix formulation for open quantum systems. In the book, relevant transport observables, like the current or its higher order cumulants, are obtained by evaluating quantum statistical averages. This approach requires the knowledge of the reduced density matrix of the interacting nanosystems. The formulation for addressing transport problems, based on the evolution of the reduced density operator in Liouville space, is highly versatile. It enables the treatment of charge and spin transport across various realistic nanostructures. Topics encompass standard Coulomb blockade, cotunneling phenomena in quantum dots, vibrational and Franck-Condon effects in molecular junctions, as well as many-body interference observed in double quantum dots or carbon nanotubes. Derived from lectures tailored for graduate and advanced students at the University of Regensburg in Germany, this book is enriched with exercises and step-by-step derivations.
Quantum Triangulations
by Annalisa Marzuoli Mauro CarforaResearch on polyhedral manifolds often points to unexpected connections between very distinct aspects of Mathematics and Physics. In particular triangulated manifolds play quite a distinguished role in such settings as Riemann moduli space theory, strings and quantum gravity, topological quantum field theory, condensed matter physics, and critical phenomena. Not only do they provide a natural discrete analogue to the smooth manifolds on which physical theories are typically formulated, but their appearance is rather often a consequence of an underlying structure which naturally calls into play non-trivial aspects of representation theory, of complex analysis and topology in a way which makes manifest the basic geometric structures of the physical interactions involved. Yet, in most of the existing literature, triangulated manifolds are still merely viewed as a convenient discretization of a given physical theory to make it more amenable for numerical treatment. The motivation for these lectures notes is thus to provide an approachable introduction to this topic, emphasizing the conceptual aspects, and probing, through a set of cases studies, the connection between triangulated manifolds and quantum physics to the deepest. This volume addresses applied mathematicians and theoretical physicists working in the field of quantum geometry and its applications.
Quantum Variational Calculus
by Agnieszka B. Malinowska Delfim F. M. TorresThis Brief puts together two subjects, quantum and variational calculi by considering variational problems involving Hahn quantum operators. The main advantage of its results is that they are able to deal with nondifferentiable (even discontinuous) functions, which are important in applications. Possible applications in economics are discussed. Economists model time as continuous or discrete. Although individual economic decisions are generally made at discrete time intervals, they may well be less than perfectly synchronized in ways discrete models postulate. On the other hand, the usual assumption that economic activity takes place continuously, is nothing else than a convenient abstraction that in many applications is far from reality. The Hahn quantum calculus helps to bridge the gap between the two families of models: continuous and discrete. Quantum Variational Calculus is self-contained and unified in presentation. It provides an opportunity for an introduction to the quantum calculus of variations for experienced researchers but may be used as an advanced textbook by graduate students and even ambitious undergraduates as well. The explanations in the book are detailed to capture the interest of the curious reader, and complete to provide the necessary background material needed to go further into the subject and explore the rich research literature, motivating further research activity in the area.
Quantum and Blockchain for Modern Computing Systems: Quantum and Blockchain Technologies: Current Trends and Challenges (Lecture Notes on Data Engineering and Communications Technologies #133)
by Ajith Abraham Adarsh Kumar Sukhpal Singh GillThis book states that blockchain technology provides a secure distributed, peer-to-peer, and decentralized network with advanced cryptography primitives and protocols. The important question that arises in the quantum computing world is to test the existing blockchain networks against quantum attacks and design quantum computing enabled secure blockchain solutions. This book encourages professionals from different fields to provide blockchain and quantum technology-integrated solutions that incorporate low-cost, effective QoS, fast, secure, and futuristic demands. This book has surveyed and proposed approaches that improve quantum computing and cryptography protocols. Quantum computing and quantum science are not just helpful in software but the hardware world as well. To design networks with quantum science, quantum-enabled devices like quantum memories and quantum repeaters can be useful to demonstrate for organizations. For example, designing a single quantum repeater for long-distance quantum communication is useful in reducing the network cost, and ensuring better security levels. This book has introduced the quantum computing and blockchain technology aspects, their integration approaches and future directions.
Quantum f-Divergences in von Neumann Algebras: Reversibility of Quantum Operations (Mathematical Physics Studies)
by Fumio HiaiRelative entropy has played a significant role in various fields of mathematics and physics as the quantum version of the Kullback–Leibler divergence in classical theory. Many variations of relative entropy have been introduced so far with applications to quantum information and related subjects. Typical examples are three different classes, called the standard, the maximal, and the measured f-divergences, all of which are defined in terms of (operator) convex functions f on (0,∞) and have respective mathematical and information theoretical backgrounds. The α-Rényi relative entropy and its new version called the sandwiched α-Rényi relative entropy have also been useful in recent developments of quantum information.In the first half of this monograph, the different types of quantum f-divergences and the Rényi-type divergences mentioned above in the general von Neumann algebra setting are presented for study. While quantum information has been developing mostly in the finite-dimensional setting, it is widely believed that von Neumann algebras provide the most suitable framework in studying quantum information and related subjects. Thus, the advance of quantum divergences in von Neumann algebras will be beneficial for further development of quantum information. Quantum divergences are functions of two states (or more generally, two positive linear functionals) on a quantum system and measure the difference between the two states. They are often utilized to address such problems as state discrimination, error correction, and reversibility of quantum operations. In the second half of the monograph, the reversibility/sufficiency theory for quantum operations (quantum channels) between von Neumann algebras via quantum f-divergences is explained, thus extending and strengthening Petz' previous work.For the convenience of the reader, an appendix including concise accounts of von Neumann algebras is provided.
Quantum versus Classical Mechanics and Integrability Problems: towards a unification of approaches and tools
by Maciej BłaszakThis accessible monograph introduces physicists to the general relation between classical and quantum mechanics based on the mathematical idea of deformation quantization and describes an original approach to the theory of quantum integrable systems developed by the author.The first goal of the book is to develop of a common, coordinate free formulation of classical and quantum Hamiltonian mechanics, framed in common mathematical language.In particular, a coordinate free model of quantum Hamiltonian systems in Riemannian spaces is formulated, based on the mathematical idea of deformation quantization, as a complete physical theory with an appropriate mathematical accuracy.The second goal is to develop of a theory which allows for a deeper understanding of classical and quantum integrability. For this reason the modern separability theory on both classical and quantum level is presented. In particular, the book presents a modern geometric separability theory, based on bi-Poissonian and bi-presymplectic representations of finite dimensional Liouville integrable systems and their admissible separable quantizations.The book contains also a generalized theory of classical Stäckel transforms and the discussion of the concept of quantum trajectories.In order to make the text consistent and self-contained, the book starts with a compact overview of mathematical tools necessary for understanding the remaining part of the book. However, because the book is dedicated mainly to physicists, despite its mathematical nature, it refrains from highlighting definitions, theorems or lemmas.Nevertheless, all statements presented are either proved or the reader is referred to the literature where the proof is available.
Quantum, Probability, Logic: The Work and Influence of Itamar Pitowsky (Jerusalem Studies in Philosophy and History of Science)
by Meir Hemmo Orly ShenkerThis volume provides a broad perspective on the state of the art in the philosophy and conceptual foundations of quantum mechanics. Its essays take their starting point in the work and influence of Itamar Pitowsky, who has greatly influenced our understanding of what is characteristically non-classical about quantum probabilities and quantum logic, and this serves as a vantage point from which they reflect on key ongoing debates in the field. Readers will find a definitive and multi-faceted description of the major open questions in the foundations of quantum mechanics today, including: Is quantum mechanics a new theory of (contextual) probability? Should the quantum state be interpreted objectively or subjectively? How should probability be understood in the Everett interpretation of quantum mechanics? What are the limits of the physical implementation of computation? The impact of this volume goes beyond the exposition of Pitowsky’s influence: it provides a unique collection of essays by leading thinkers containing profound reflections on the field.Chapter 1. Classical logic, classical probability, and quantum mechanics (Samson Abramsky) Chapter 2. Why Scientific Realists Should Reject the Second Dogma of Quantum Mechanic (Valia Allori) Chapter 3. Unscrambling Subjective and Epistemic Probabilities (Guido Bacciagaluppi) Chapter 4. Wigner’s Friend as a Rational Agent (Veronika Baumann, Časlav Brukner) Chapter 5. Pitowsky's Epistemic Interpretation of Quantum Mechanics and the PBR Theorem (Yemima Ben-Menahem) Chapter 6. On the Mathematical Constitution and Explanation of Physical Facts (Joseph Berkovitz) Chapter 7. Everettian probabilities, the Deutsch-Wallace theorem and the Principal Principle (Harvey R. Brown, Gal Ben Porath) Chapter 8. ‘Two Dogmas’ Redu (Jeffrey Bub) Chapter 9. Physical Computability Theses (B. Jack Copeland, Oron Shagrir) Chapter 10. Agents in Healey’s Pragmatist Quantum Theory: A Comparison with Pitowsky’s Approach to Quantum Mechanics (Mauro Dorato) Chapter 11. Quantum Mechanics As a Theory of Observables and States and, Thereby, As a Theory of Probability (John Earman, Laura Ruetsche) Chapter 12. The Measurement Problem and two Dogmas about Quantum Mechanic (Laura Felline) Chapter 13. There Is More Than One Way to Skin a Cat: Quantum Information Principles In a Finite World(Amit Hagar) Chapter 14. Is Quantum Mechanics a New Theory of Probability? (Richard Healey) Chapter 15. Quantum Mechanics as a Theory of Probability (Meir Hemmo, Orly Shenker) Chapter 16. On the Three Types of Bell's Inequalities (Gábor Hofer-Szabó) Chapter 17. On the Descriptive Power of Probability Logic (Ehud Hrushovski) Chapter 18. The Argument against Quantum Computers (Gil Kalai) Chapter 19. Why a Relativistic Quantum Mechanical World Must be Indeterministic (Avi Levy, Meir Hemmo) Chapter 20. Subjectivists about Quantum Probabilities Should be Realists about Quantum States (Wayne C. Myrvold) Chapter 21. The Relativistic Einstein-Podolsky-Rosen Argument (Michael Redhead) Chapter 22. What price statistical independence? How Einstein missed the photon.(Simon Saunders) Chapter 23. How (Maximally) Contextual is Quantum Mechanics? (Andrew W. Simmons) Chapter 24. Roots and (Re)Sources of Value (In)Definiteness Versus Contextuality (Karl Svozil) Chapter 25: Schrödinger’s Reaction to the EPR Paper (Jos Uffink) Chapter 26. Derivations of the Born Rule (Lev Vaidman) Chapter 27. Dynamical States and the Conventionality of (Non-) Classicality (Alexander Wilce).
Quantum-Like Models for Information Retrieval and Decision-Making (STEAM-H: Science, Technology, Engineering, Agriculture, Mathematics & Health)
by Bourama Toni Andrei Khrennikov Diederik Aerts Massimo MelucciRecent years have been characterized by tremendous advances in quantum information and communication, both theoretically and experimentally. In addition, mathematical methods of quantum information and quantum probability have begun spreading to other areas of research, beyond physics. One exciting new possibility involves applying these methods to information science and computer science (without direct relation to the problems of creation of quantum computers). The aim of this Special Volume is to encourage scientists, especially the new generation (master and PhD students), working in computer science and related mathematical fields to explore novel possibilities based on the mathematical formalisms of quantum information and probability. The contributing authors, who hail from various countries, combine extensive quantum methods expertise with real-world experience in application of these methods to computer science. The problems considered chiefly concern quantum information-probability based modeling in the following areas: information foraging; interactive quantum information access; deep convolutional neural networks; decision making; quantum dynamics; open quantum systems; and theory of contextual probability. The book offers young scientists (students, PhD, postdocs) an essential introduction to applying the mathematical apparatus of quantum theory to computer science, information retrieval, and information processes.
Quantum-Mechanical Signal Processing and Spectral Analysis (Series in Atomic Molecular Physics)
by Dzevad BelkicQuantum-Mechanical Signal Processing and Spectral Analysis describes the novel application of quantum mechanical methods to signal processing across a range of interdisciplinary research fields. Conventionally, signal processing is viewed as an engineering discipline with its own specific scope, methods, concerns and priorities, not usually encompassing quantum mechanics. However, the dynamics of systems that generate time signals can be successfully described by the general principles and methods of quantum physics, especially within the Schroedinger framework. Most time signals that are measured experimentally are mathematically equivalent to quantum-mechanical auto-correlation functions built from the evolution operator and wavefunctions. This fact allows us to apply the rich conceptual strategies and mathematical apparatus of quantum mechanics to signal processing. Among the leading quantum-mechanical signal processing methods, this book emphasizes the role of Pade approximant and the Lanczos algorithm, highlighting the major benefits of their combination. These two methods are carefully incorporated within a unified framework of scattering and spectroscopy, developing an algorithmic power that can be exported to other disciplines. The novelty of the author's approach to key signal processing problems, the harmonic inversion and the moment problem, is in establishing the Pade approximant and Lanczos algorithm as entirely algerbraic spectral estimators. This is of paramount theoretical and practical importance, as now spectral analysis can be carried out from closed analytical expressions. This overrides the notorious mathematical ill-conditioning problems with round-off errors that plague inverse reconstructions in those fields that rely upon signal processing. Quantum-Mechanical Signal Processing and Spectral Analysis will be an invaluable resource for researchers involved in signal processing across a wide range of disciplines.
Quarks, Leptons and the Big Bang
by Jonathan AlldayCHOICE: Highly Recommended Quarks, Leptons and The Big Bang, Third Edition, is a clear, readable and self-contained introduction to particle physics and related areas of cosmology. It bridges the gap between non-technical popular accounts and textbooks for advanced students. The book concentrates on presenting the subject from the modern perspective of quarks, leptons and the forces between them. This book will appeal to students, teachers and general science readers interested in fundamental ideas of modern physics. This edition brings the book completely up to date by including advances in particle physics and cosmology, such as the discovery of the Higgs boson, the LIGO gravitational wave discovery and the WMAP and PLANCK results.
Quasi-Exactly Solvable Models in Quantum Mechanics
by A.G UshveridzeExactly solvable models, that is, models with explicitly and completely diagonalizable Hamiltonians are too few in number and insufficiently diverse to meet the requirements of modern quantum physics. Quasi-exactly solvable (QES) models (whose Hamiltonians admit an explicit diagonalization only for some limited segments of the spectrum) provide a practical way forward.Although QES models are a recent discovery, the results are already numerous. Collecting the results of QES models in a unified and accessible form, Quasi-Exactly Solvable Models in Quantum Mechanics provides an invaluable resource for physicists using quantum mechanics and applied mathematicians dealing with linear differential equations. By generalizing from one-dimensional QES models, the expert author constructs the general theory of QES problems in quantum mechanics. He describes the connections between QES models and completely integrable theories of magnetic chains, determines the spectra of QES Schrödinger equations using the Bethe-Iansatz solution of the Gaudin model, discusses hidden symmetry properties of QES Hamiltonians, and explains various Lie algebraic and analytic approaches to the problem of quasi-exact solubility in quantum mechanics.Because the applications of QES models are very wide, such as, for investigating non-perturbative phenomena or as a good approximation to exactly non-solvable problems, researchers in quantum mechanics-related fields cannot afford to be unaware of the possibilities of QES models.