- Table View
- List View
Set Optimization and Applications - The State of the Art
by Andreas H. Hamel Frank Heyde Andreas Löhne Birgit Rudloff Carola SchrageThis volume presents five surveys with extensivebibliographies and six original contributions on set optimization and its applicationsin mathematical finance and game theory. The topics range from moreconventional approaches that look for minimal/maximal elements with respect tovector orders or set relations, to the new complete-lattice approach thatcomprises a coherent solution concept for set optimization problems, along withexistence results, duality theorems, optimality conditions, variationalinequalities and theoretical foundations for algorithms. Modern approaches toscalarization methods can be found as well as a fundamental contribution to conditionalanalysis. The theory is tailor-made for financial applications, in particular riskevaluation and [super-]hedging for market models with transaction costs, but italso provides a refreshing new perspective on vector optimization. There is nocomparable volume on the market, making the book an invaluable resource forresearchers working in vector optimization and multi-criteria decision-making, mathematicalfinance and economics as well as [set-valued] variational analysis.
Set Theory
by Abhijit DasguptaWhat is a number? What is infinity? What is continuity? What is order? Answers to these fundamental questions obtained by late nineteenth-century mathematicians such as Dedekind and Cantor gave birth to set theory. This textbook presents classical set theory in an intuitive but concrete manner. To allow flexibility of topic selection in courses, the book is organized into four relatively independent parts with distinct mathematical flavors. Part I begins with the Dedekind-Peano axioms and ends with the construction of the real numbers. The core Cantor-Dedekind theory of cardinals, orders, and ordinals appears in Part II. Part III focuses on the real continuum. Finally, foundational issues and formal axioms are introduced in Part IV. Each part ends with a postscript chapter discussing topics beyond the scope of the main text, ranging from philosophical remarks to glimpses into landmark results of modern set theory such as the resolution of Lusin's problems on projective sets using determinacy of infinite games and large cardinals. Separating the metamathematical issues into an optional fourth part at the end makes this textbook suitable for students interested in any field of mathematics, not just for those planning to specialize in logic or foundations. There is enough material in the text for a year-long course at the upper-undergraduate level. For shorter one-semester or one-quarter courses, a variety of arrangements of topics are possible. The book will be a useful resource for both experts working in a relevant or adjacent area and beginners wanting to learn set theory via self-study.
Set Theory
by Ralf SchindlerThis textbook gives an introduction to axiomatic set theory and examines the prominent questions that are relevant in current research in a manner that is accessible to students. Its main theme is the interplay of large cardinals, inner models, forcing and descriptive set theory. The following topics are covered: * Forcing and constructability * The Solovay-Shelah Theorem i. e. the equiconsistency of 'every set of reals is Lebesgue measurable' with one inaccessible cardinal * Fine structure theory and a modern approach to sharps * Jensen's Covering Lemma * The equivalence of analytic determinacy with sharps * The theory of extenders and iteration trees * A proof of projective determinacy from Woodin cardinals. Set Theory requires only a basic knowledge of mathematical logic and will be suitable for advanced students and researchers.
Set Theory Essentials
by Emil MilewskiREA's Essentials provide quick and easy access to critical information in a variety of different fields, ranging from the most basic to the most advanced. As its name implies, these concise, comprehensive study guides summarize the essentials of the field covered. Essentials are helpful when preparing for exams, doing homework and will remain a lasting reference source for students, teachers, and professionals. Set Theory includes elementary logic, sets, relations, functions, denumerable and non-denumerable sets, cardinal numbers, Cantor's theorem, axiom of choice, and order relations.
Set Theory and Logic
by Robert R. StollSet Theory and Logic is the result of a course of lectures for advanced undergraduates, developed at Oberlin College for the purpose of introducing students to the conceptual foundations of mathematics. Mathematics, specifically the real number system, is approached as a unity whose operations can be logically ordered through axioms. One of the most complex and essential of modern mathematical innovations, the theory of sets (crucial to quantum mechanics and other sciences), is introduced in a most careful concept manner, aiming for the maximum in clarity and stimulation for further study in set logic. Contents include: Sets and Relations -- Cantor's concept of a set, etc.Natural Number Sequence -- Zorn's Lemma, etc.Extension of Natural Numbers to Real NumbersLogic -- the Statement and Predicate Calculus, etc.Informal Axiomatic MathematicsBoolean AlgebraInformal Axiomatic Set TheorySeveral Algebraic Theories -- Rings, Integral Domains, Fields, etc.First-Order Theories -- Metamathematics, etc.Symbolic logic does not figure significantly until the final chapter. The main theme of the book is mathematics as a system seen through the elaboration of real numbers; set theory and logic are seen s efficient tools in constructing axioms necessary to the system. Mathematics students at the undergraduate level, and those who seek a rigorous but not unnecessarily technical introduction to mathematical concepts, will welcome the return to print of this most lucid work. "Professor Stoll . . . has given us one of the best introductory texts we have seen." -- Cosmos. "In the reviewer's opinion, this is an excellent book, and in addition to its use as a textbook (it contains a wealth of exercises and examples) can be recommended to all who wish an introduction to mathematical logic less technical than standard treatises (to which it can also serve as preliminary reading)." -- Mathematical Reviews.
Set Theory-An Operational Approach: An Operational Approach
by Luis E. SanchisThis volume presents a novel approach to set theory that is entirely operational. This approach avoids the existential axioms associated with traditional Zermelo-Fraenkel set theory, and provides both a foundation for set theory and a practical approach to learning the subject. It is written at the professional/graduate student level, and will be of interest to mathematical logicians, philosophers of mathematics and students of theoretical computer science.

Set Theory: A First Course (Cambridge Mathematical Textbooks Ser.)
by Daniel W. CunninghamSet theory is a rich and beautiful subject whose fundamental concepts permeate virtually every branch of mathematics. One could say that set theory is a unifying theory for mathematics, since nearly all mathematical concepts and results can be formalized within set theory. This textbook is meant for an upper undergraduate course in set theory. In this text, the fundamentals of abstract sets, including relations, functions, the natural numbers, order, cardinality, transfinite recursion, the axiom of choice, ordinal numbers, and cardinal numbers, are developed within the framework of axiomatic set theory. The reader will need to be comfortable reading and writing mathematical proofs. The proofs in this textbook are rigorous, clear, and complete, while remaining accessible to undergraduates who are new to upper-level mathematics. Exercises are included at the end of each section in a chapter, with useful suggestions for the more challenging exercises.
Set Theory: An Introduction to Axiomatic Reasoning (Textbooks in Mathematics)
by Robert AndréContemporary students of mathematics differ considerably from those of half a century ago. In spite of this, many textbooks written decades ago, and now considered to be “classics”, are still prescribed for students today. These texts are not suitable for today’s students. This text is meant for and written to today’s mathematics students. Set theory is a pure mathematics endeavor in the sense that it seems to have no immediate applications; yet the knowledge and skills developed in such a course can easily branch out to various fields of both pure mathematics and applied mathematics.Rather than transforming the reader into a practicing mathematician, this book is more designed to initiate the reader to what may be called “mathematical thinking” while developing knowledge about foundations of modern mathematics. Without this insight, becoming a practicing mathematician is much more daunting.The main objective is twofold. The students will develop some fundamental understanding of the foundations of mathematics and elements of set theory, in general. In the process, the student will develop skills in proving simple mathematical statements with “mathematical rigor”.Carefully presented detailed proofs and rigorous chains of logical arguments will guide the students from the fundamental ZFC-axioms and definitions to show why a basic mathematical statement must hold true. The student will recognize the role played by each fundamental axiom in development of modern mathematics. The student will learn to distinguish between a correct mathematical proof and an erroneous one. The subject matter is presented while bypassing the complexities encountered when using formal logic.
Set Theory: The Structure Of Arithmetic (Dover Books on Mathematics)
by Norman T. Hamilton Joseph LandinThis text is formulated on the fundamental idea that much of mathematics, including the classical number systems, can best be based on set theory. Beginning with a discussion of the rudiments of set theory, authors Norman T. Hamilton and Joseph Landin lead readers through a construction of the natural number system, discussing the integers and the rational numbers, and concluding with an in-depth examination of the real numbers. Drawn from lecture notes for a course intended primarily for high school mathematics teachers, this volume was designed to answer the question, "What is a number?" and to provide a foundation for the study of abstract algebra, elementary Euclidean geometry, and analysis. Upon completion of this treatment — which is suitable for high school mathematics teachers and advanced high school students — readers should be well prepared for introductory courses in abstract algebra and real variables.
Set, Measure and Probability Theory (River Publishers Series in Mathematical, Statistical and Computational Modelling for Engineering)
by Marcelo S. Alencar Raphael T. AlencarThis book introduces the basic concepts of set theory, measure theory, the axiomatic theory of probability, random variables and multidimensional random variables, functions of random variables, convergence theorems, laws of large numbers, and fundamental inequalities. The idea is to present a seamless connection between the more abstract advanced set theory, the fundamental concepts from measure theory, and integration, to introduce the axiomatic theory of probability, filling in the gaps from previous books and leading to an interesting, robust and, hopefully, self-contained exposition of the theory. This book also presents an account of the historical evolution of probability theory as a mathematical discipline. Each chapter presents a short biography of the important scientists who helped develop the subject. Appendices include Fourier transforms in one and two dimensions, important formulas and inequalities and commented bibliography. Many examples, illustrations and graphics help the reader understand the theory.
Set-Indexed Martingales (Chapman & Hall/CRC Monographs on Statistics and Applied Probability)
by Ely Merzbach Gail IvanoffSet-Indexed Martingales offers a unique, comprehensive development of a general theory of Martingales indexed by a family of sets. The authors establish-for the first time-an appropriate framework that provides a suitable structure for a theory of Martingales with enough generality to include many interesting examples. Developed from first principles, the theory brings together the theories of Martingales with a directed index set and set-indexed stochastic processes. Part One presents several classical concepts extended to this setting, including: stopping, predictability, Doob-Meyer decompositions, martingale characterizations of the set-indexed Poisson process, and Brownian motion. Part Two addresses convergence of sequences of set-indexed processes and introduces functional convergence for processes whose sample paths live in a Skorokhod-type space and semi-functional convergence for processes whose sample paths may be badly behaved.Completely self-contained, the theoretical aspects of this work are rich and promising. With its many important applications-especially in the theory of spatial statistics and in stochastic geometry- Set Indexed Martingales will undoubtedly generate great interest and inspire further research and development of the theory and applications.
Set-Theoretic Methods for the Social Sciences
by Carsten Q. Schneider Claudius WagemannQualitative Comparative Analysis (QCA) and other set-theoretic methods distinguish themselves from other approaches to the study of social phenomena by using sets and the search for set relations. In virtually all social science fields, statements about social phenomena can be framed in terms of set relations, and using set-theoretic methods to investigate these statements is therefore highly valuable. This book guides readers through the basic principles of set theory and then on to the applied practices of QCA. It provides a thorough understanding of basic and advanced issues in set-theoretic methods together with tricks of the trade, software handling and exercises. Most arguments are introduced using examples from existing research. The use of QCA is increasing rapidly and the application of set-theory is both fruitful and still widely misunderstood in current empirical comparative social research. This book provides an invaluable guide to these methods for researchers across the social sciences.
Set-Theoretic Methods in Control
by Franco Blanchini Stefano MianiThe second edition of this monograph describes the set-theoretic approach for the control and analysis of dynamic systems, both from a theoretical and practical standpoint. This approach is linked to fundamental control problems, such as Lyapunov stability analysis and stabilization, optimal control, control under constraints, persistent disturbance rejection, and uncertain systems analysis and synthesis. Completely self-contained, this book provides a solid foundation of mathematical techniques and applications, extensive references to the relevant literature, and numerous avenues for further theoretical study. All the material from the first edition has been updated to reflect the most recent developments in the field, and a new chapter on switching systems has been added. Each chapter contains examples, case studies, and exercises to allow for a better understanding of theoretical concepts by practical application. The mathematical language is kept to the minimum level necessary for the adequate formulation and statement of the main concepts, yet allowing for a detailed exposition of the numerical algorithms for the solution of the proposed problems. Set-Theoretic Methods in Control will appeal to both researchers and practitioners in control engineering and applied mathematics. It is also well-suited as a textbook for graduate students in these areas.
Set-Valued Stochastic Integrals and Applications (Springer Optimization and Its Applications #157)
by Michał KisielewiczThis book is among the first concise presentations of the set-valued stochastic integration theory as well as its natural applications, as well as the first to contain complex approach theory of set-valued stochastic integrals. Taking particular consideration of set-valued Itô , set-valued stochastic Lebesgue, and stochastic Aumann integrals, the volume is divided into nine parts. It begins with preliminaries of mathematical methods that are then applied in later chapters containing the main results and some of their applications, and contains many new problems. Methods applied in the book are mainly based on functional analysis, theory of probability processes, and theory of set-valued mappings.The volume will appeal to students of mathematics, economics, and engineering, as well as to mathematics professionals interested in applications of the theory of set-valued stochastic integrals.
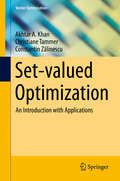
Set-valued Optimization
by Akhtar A. Khan Christiane Tammer Constantin ZălinescuSet-valued optimization is a vibrant and expanding branch of mathematics that deals with optimization problems where the objective map and/or the constraints maps are set-valued maps acting between certain spaces. Since set-valued maps subsumes single valued maps, set-valued optimization provides an important extension and unification of the scalar as well as the vector optimization problems. Therefore this relatively new discipline has justifiably attracted a great deal of attention in recent years. This book presents, in a unified framework, basic properties on ordering relations, solution concepts for set-valued optimization problems, a detailed description of convex set-valued maps, most recent developments in separation theorems, scalarization techniques, variational principles, tangent cones of first and higher order, sub-differential of set-valued maps, generalized derivatives of set-valued maps, sensitivity analysis, optimality conditions, duality and applications in economics among other things.
Sets of Finite Perimeter and Geometric Variational Problems: An Introduction to Geometric Measure Theory
by Francesco MaggiThe marriage of analytic power to geometric intuition drives many of today's mathematical advances, yet books that build the connection from an elementary level remain scarce. This engaging introduction to geometric measure theory bridges analysis and geometry, taking readers from basic theory to some of the most celebrated results in modern analysis. The theory of sets of finite perimeter provides a simple and effective framework. Topics covered include existence, regularity, analysis of singularities, characterization and symmetry results for minimizers in geometric variational problems, starting from the basics about Hausdorff measures in Euclidean spaces and ending with complete proofs of the regularity of area-minimizing hypersurfaces up to singular sets of codimension 8. Explanatory pictures, detailed proofs, exercises and remarks providing heuristic motivation and summarizing difficult arguments make this graduate-level textbook suitable for self-study and also a useful reference for researchers. Readers require only undergraduate analysis and basic measure theory.
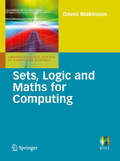
Sets, Logic and Maths for Computing
by David MakinsonThis easy-to-follow textbook introduces the mathematical language, knowledge and problem-solving skills that undergraduates need to study computing. The language is in part qualitative, with concepts such as set, relation, function and recursion/induction; but it is also partly quantitative, with principles of counting and finite probability. Entwined with both are the fundamental notions of logic and their use for representation and proof. Features: teaches finite math as a language for thinking, as much as knowledge and skills to be acquired; uses an intuitive approach with a focus on examples for all general concepts; brings out the interplay between the qualitative and the quantitative in all areas covered, particularly in the treatment of recursion and induction; balances carefully the abstract and concrete, principles and proofs, specific facts and general perspectives; includes highlight boxes that raise common queries and clear confusions; provides numerous exercises, with selected solutions.
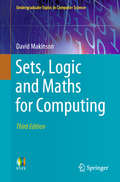
Sets, Logic and Maths for Computing (Undergraduate Topics in Computer Science)
by David MakinsonThis easy-to-understand textbook introduces the mathematical language and problem-solving tools essential to anyone wishing to enter the world of computer and information sciences. Specifically designed for the student who is intimidated by mathematics, the book offers a concise treatment in an engaging style.The thoroughly revised third edition features a new chapter on relevance-sensitivity in logical reasoning and many additional explanations on points that students find puzzling, including the rationale for various shorthand ways of speaking and ‘abuses of language’ that are convenient but can give rise to misunderstandings. Solutions are now also provided for all exercises.Topics and features: presents an intuitive approach, emphasizing how finite mathematics supplies a valuable language for thinking about computation; discusses sets and the mathematical objects built with them, such as relations and functions, as well as recursion and induction; introduces core topics of mathematics, including combinatorics and finite probability, along with the structures known as trees; examines propositional and quantificational logic, how to build complex proofs from simple ones, and how to ensure relevance in logic; addresses questions that students find puzzling but may have difficulty articulating, through entertaining conversations between Alice and the Mad Hatter; provides an extensive set of solved exercises throughout the text.This clearly-written textbook offers invaluable guidance to students beginning an undergraduate degree in computer science. The coverage is also suitable for courses on formal methods offered to those studying mathematics, philosophy, linguistics, economics, and political science. Assuming only minimal mathematical background, it is ideal for both the classroom and independent study.
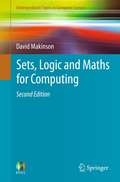
Sets, Logic and Maths for Computing, 2nd Ed.
by David MakinsonThis easy-to-follow textbook introduces the mathematical language, knowledge and problem-solving skills that undergraduates need to study computing. The language is in part qualitative, with concepts such as set, relation, function and recursion/induction; but it is also partly quantitative, with principles of counting and finite probability. Entwined with both are the fundamental notions of logic and their use for representation and proof. Features: teaches finite math as a language for thinking, as much as knowledge and skills to be acquired; uses an intuitive approach with a focus on examples for all general concepts; brings out the interplay between the qualitative and the quantitative in all areas covered, particularly in the treatment of recursion and induction; balances carefully the abstract and concrete, principles and proofs, specific facts and general perspectives; includes highlight boxes that raise common queries and clear confusions; provides numerous exercises, with selected solutions.
Sets, Models and Proofs (Springer Undergraduate Mathematics Series)
by Ieke Moerdijk Jaap Van OostenThis textbook provides a concise and self-contained introduction to mathematical logic, with a focus on the fundamental topics in first-order logic and model theory. Including examples from several areas of mathematics (algebra, linear algebra and analysis), the book illustrates the relevance and usefulness of logic in the study of these subject areas.The authors start with an exposition of set theory and the axiom of choice as used in everyday mathematics. Proceeding at a gentle pace, they go on to present some of the first important results in model theory, followed by a careful exposition of Gentzen-style natural deduction and a detailed proof of Gödel’s completeness theorem for first-order logic. The book then explores the formal axiom system of Zermelo and Fraenkel before concluding with an extensive list of suggestions for further study. The present volume is primarily aimed at mathematics students who are already familiar with basic analysis, algebra and linear algebra. It contains numerous exercises of varying difficulty and can be used for self-study, though it is ideally suited as a text for a one-semester university course in the second or third year.
Sets, Sequences and Mappings: The Basic Concepts of Analysis
by Kenneth Anderson Dick Wick HallStudents progressing to advanced calculus are frequently confounded by the dramatic shift from mechanical to theoretical and from concrete to abstract. This text bridges the gap, offering a systematic development of the real number system and careful treatment of mappings, sequences, limits, continuity, and metric spaces.The first five chapters consist of a systematic development of many of the important properties of the real number system, plus detailed treatment of such concepts as mappings, sequences, limits, and continuity. The sixth and final chapter discusses metric spaces and generalizes many of the earlier concepts and results involving arbitrary metric spaces.An index of axioms and key theorems appears at the end of the book, and more than 300 problems amplify and supplement the material within the text. Geared toward students who have taken several semesters of basic calculus, this volume is an ideal prerequisite for mathematics majors preparing for a two-semester course in advanced calculus.
Setting Environmental Standards: The Statistical Approach to Handling Uncertainty and Variation
by Vic Barnett A. O'HaganIntroducing a novel approach to setting environmental pollution standards that allow for proper treatment of uncertainty and variation, this book surveys the forms of standards and proposes a new kind of "statistically verifiable ideal standard."Setting Environmental Standards includes:a current analysis regarding the treatment of uncertainty and variation in environmental standard settinga review of basic principles in standard setting, including costs, actions and effects, and benefitsexamples where uncertainty and variation have been well-treated in current practice as well as examples where clear deficiencies are apparentspecific proposals for the future approach to setting environmental pollution standards - encompassing the anticipated elements of uncertainty and variabilityThe issues discussed serve statisticians as well as those persons involved with environmental standards. Scientists in agencies responsible for setting standards, in organizations advising such agencies or working in industries subject to these standards, will find Setting Environmental Standards an invaluable reference.
Seven Fundamental Concepts in Spacetime Physics (SpringerBriefs in Physics)
by Vesselin PetkovThe book presents seven fundamental concepts in spacetime physics mostly by following Hermann Minkowski’s revolutionary ideas summarized in his 1908 lecture "Space and Time." These concepts are: spacetime, inertial and accelerated motion in spacetime physics, the origin and nature of inertia in spacetime physics, relativistic mass, gravitation, gravitational waves, and black holes. They have been selected because they appear to be causing most misconceptions and confusion in spacetime physics.
Seven Fundamental Concepts in Spacetime Physics (SpringerBriefs in Physics)
by Vesselin PetkovThe book presents seven fundamental concepts in spacetime physics mostly by following Hermann Minkowski’s revolutionary ideas summarized in his 1908 lecture "Space and Time." These concepts are: spacetime, inertial and accelerated motion in spacetime physics, the origin and nature of inertia in spacetime physics, relativistic mass, gravitation, gravitational waves, and black holes. They have been selected because they appear to be causing most misconceptions and confusion in spacetime physics. This second edition has been revised to include additional clarifications, more detailed elaboration of the arguments and also new material published in the interim.
Seventeenth-Century Indivisibles Revisited
by Vincent JullienThe tremendous success of indivisibles methods in geometry in the seventeenth century, responds to a vast project: installation of infinity in mathematics. The pathways by the authors are very diverse, as are the characterizations of indivisibles, but there are significant factors of unity between the various doctrines of indivisible; the permanence of the language used by all authors is the strongest sign. These efforts do not lead to the stabilization of a mathematical theory (with principles or axioms, theorems respecting these first statements, followed by applications to a set of geometric situations), one must nevertheless admire the magnitude of the results obtained by these methods and highlights the rich relationships between them and integral calculus. The present book aims to be exhaustive since it analyzes the works of all major inventors of methods of indivisibles during the seventeenth century, from Kepler to Leibniz. It takes into account the rich existing literature usually devoted to a single author. This book results from the joint work of a team of specialists able to browse through this entire important episode in the history of mathematics and to comment it. The list of authors involved in indivisibles´ field is probably sufficient to realize the richness of this attempt; one meets Kepler, Cavalieri, Galileo, Torricelli, Gregoire de Saint Vincent, Descartes, Roberval, Pascal, Tacquet, Lalouvère, Guldin, Barrow, Mengoli, Wallis, Leibniz, Newton.