- Table View
- List View
Statistics Made Simple For School Leaders: Data-Driven Decision Making
by David J. Carroll Susan Rovezzi CarrollThe chief executive officer of a corporation is not much different from a public school administrator. While CEOs base many of their decisions on data, for school administrators, this type of research may conjure up miserable memories of searching for information to meet a graduate school requirement. However, the value of data-based decision making will continue to escalate and the school community--students, teachers, parents and the general public--expect this information to come from their administrators. Administrators are called on to be accountable, but few are capable of presenting the mountain of data that they collect in a cohesive and strategic manner. Most statistical books are focused on statistical theory versus application, but Statistics Made Simple for School Leaders presents statistics in a simple, practical, conceptual, and immediately applicable manner. It enables administrators to take their data and manage it into strategic information so the results can be used for action plans that benefit the school system. The approach is "user friendly" and leaves the reader with a confident can-do attitude to communicate results and plans to staff and the community.
Statistics Super Review
by Statistics Study GuidesGet all you need to know with Super Reviews! Each Super Review is packed with in-depth, student-friendly topic reviews that fully explain everything about the subject. The Statistics Super Review includes frequency distributions, numerical methods of describing data, measures of variability, probability, distributions, sampling theory, statistical inference, general linear model inferences, experimental design, the chi-square test, and time series. Take the Super Review quizzes to see how much you've learned - and where you need more study. Makes an excellent study aid and textbook companion. Great for self-study! DETAILS - From cover to cover, each in-depth topic review is easy-to-follow and easy-to-grasp - Perfect when preparing for homework, quizzes, and exams! - Review questions after each topic that highlight and reinforce key areas and concepts - Student-friendly language for easy reading and comprehension - Includes quizzes that test your understanding of the subject
Statistics Super Review, 2nd Ed.
by The Editors of REANeed help with Statistics? Want a quick review or refresher for class? This is the book for you! REA's Statistics Super Review gives you everything you need to know!This Super Review can be used as a supplement to your high school or college textbook, or as a handy guide for anyone who needs a fast review of the subject.* Comprehensive, yet concise coverage - review covers the material that students must know about statistics. Each topic is presented in a clear and easy-to-understand format that makes learning easier.* Questions and answers for each topic - let you practice what you've learned and build your statistics skills.* End-of-chapter quizzes - gauge your understanding of the important information you need to know, so you'll be ready for any homework assignment, quiz, or test.Whether you need a quick refresher on the subject, or are prepping for your next exam, we think you'll agree that REA's Super Review provides all you need to know!
Statistics Tables: For Mathematicians, Engineers, Economists and the Behavioural and Management Sciences
by Henry R. NeaveFor three decades, Henry Neave’s Statistics Tables has been the gold standard for all students taking an introductory statistical methods course as part of their wider degree in a host of disciplines including mathematics, economics, business and management, geography and psychology. The period has seen a large increase in the level of mathematics and statistics required to achieve these qualifications and Statistics Tables has helped several generations of students meet their goals. All the features of the first edition are retained including the full range of best-known standard statistical techniques, as well as some lesser-known methods that can be hard to track down elsewhere. The explanatory introductions to each section have been updated and the second edition benefits from the inclusion of a valuable and comprehensive new section on an approach to simple but powerful investigation of process data. This will help the book continue in its position as the prime statistical reference for all students of mathematics, engineering and the social sciences, and everyone who needs effective methods for analysing data.
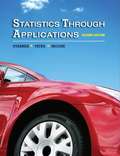
Statistics Through Applications
by David S. Moore Daniel S. Yates Daren S. StarnesWatch avideo introduction here. Statistics Through Applications (STA)is the only text written specifically for high school statistics course. Designed to be read, the book takes a data analysis approach that emphasizes conceptual understanding over computation, while recognizing that some computation is necessary. The focus is on the statistical thinking behind data gathering and interpretation. The high school statistics course is often the first applied math course students take. STAengages students in learning how statisticians contribute to our understanding of the world and helps students to become more discerning consumers of the statistics they encounter in ads, economic reports, political campaigns, and elsewhere. New and improved!STA 2efeatures expanded coverage of probability, a reorganized presentation of data analysis, a new color design and much more. Please see theposted sample chapter orrequest a copy today to see for yourself.
Statistics Through Applications
by Daren S. Starnes David Moore Daniel YatesStatistics Through Applications (STA) is the only text written specifically for high school statistics course. Designed to be read, the book takes a data analysis approach that emphasizes conceptual understanding over computation, while recognizing that some computation is necessary. The focus is on the statistical thinking behind data gathering and interpretation. The high school statistics course is often the first applied math course students take. STA engages students in learning how statisticians contribute to our understanding of the world and helps students to become more discerning consumers of the statistics they encounter in ads, economic reports, political campaigns, and elsewhere. New and improved! STA 2e features expanded coverage of probability, a reorganized presentation of data analysis, a new color design and much more.
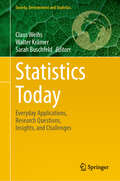
Statistics Today: Everyday Applications, Research Questions, Insights, and Challenges (Society, Environment and Statistics)
by Walter Krämer Claus Weihs Sarah BuschfeldThis book offers a broad selection of statistical applications to everyday situations, illustrating how exciting and diverse statistical analysis can be. It covers a wide variety of topics, including offering hearing-impaired people the option to enjoy music, extracting meaningful quantitative data from texts, and modeling flood disasters to help get a better grip on them. Most of the examples are not typically found in textbooks but directly relate to real-life problems encountered by the “average person”, including topics relevant for sustainable development.Technical jargon and formalism have been avoided as much as possible, and a detailed statistical background is not assumed of the reader, making the book accessible to anyone interested in current research in statistical applications. Providing an unobscured look at a thoroughly fascinating science, it will help students to develop enthusiasm for statistical issues and methods, and may even inspire ideas for their own projects.
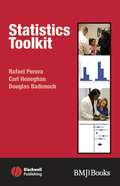
Statistics Toolkit (EBMT-EBM Toolkit Series #9)
by Douglas Badenoch Carl Heneghan Rafael PereraThis concise book will help you to interpret the statistical evidence provided by quantitative studies and to plan how to work with data in your own clinical research. Following the successful format of the Toolkit series, Statistics Toolkit guides the reader through statistical concepts using flowcharts, diagrams and real life examples to reflect concepts in a simple and practical manner. Sections include: Clear explanation of basic concepts in the context of clinical research Demonstration of how data are described, displayed and interpreted in different formats Practical glossary and key to the symbols used in statistics and a discussion of the software tools The book offers a handy, quick reference that has an easy-to-follow structure throughout, making it ideal for health care professionals and students.
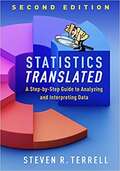
Statistics Translated: A Step-by-step Guide to Analyzing and Interpreting Data
by Steven R. TerrellRoping the reader in with humor and real-world case examples presented as mysteries to be solved, this engaging text has been updated with new cases, the latest version of SPSS, and new coverage of multivariate analysis of variance. Steven R. Terrell prepares students and practitioners to become informed consumers of statistics so that they can make decisions based on data, and understand decisions others have made. He identifies six simple steps and guides readers to master them--from identifying a researchable problem to stating a hypothesis; identifying independent and dependent variables; and selecting, computing, and interpreting appropriate statistical tests. All techniques are demonstrated both manually and with the help of SPSS software. <P><P> New to This Edition *All software instructions and examples are updated to SPSS Version 25. *Expanded chapter on the analysis of variance (ANOVA)--now covers multivariate ANOVA. *New and revised examples and quiz items pertaining to a broader range of fields, such as business, information systems, and medical sciences, along with education and psychology. <P><P> Pedagogical Features *Examples of SPSS screenshots used for analyzing data. *User-friendly cautionary notes, "Putting it All Together" recaps, and alerts, such as "notice the effect size" or "check the direction of the mean scores." *End-of-chapter "Quiz Time" exercises that guide students to answer intriguing questions like whether working from home increases productivity, or whether age affects how long it takes to complete a doctoral degree. *Lists of key terms and formulas in each chapter, plus end-of-book glossary.
Statistics Unplugged
by Sally CaldwellLearn statistics the easy way with STATISTICS UNPLUGGED! Written in a friendly, easy-to-understand style, this practical book takes the intimidation out of statistics and helps you understand the relevance of statistics to your own life. Interesting examples throughout the book allow you to see what is really going on with the numbers instead of being overwhelmed by the numbers themselves.
Statistics Using IBM SPSS: An Integrative Approach
by Sharon Lawner Weinberg Sarah Knapp AbramowitzWritten in a clear and lively tone, Statistics Using IBM SPSS provides a data-centric approach to statistics with integrated SPSS (version 22) commands, ensuring that students gain both a deep conceptual understanding of statistics and practical facility with the leading statistical software package. With 100 worked examples, the textbook guides students through statistical practice using real data and avoids complicated mathematics. Numerous end-of-chapter exercises allow students to apply and test their understanding of chapter topics, with detailed answers available online. The third edition has been updated throughout and includes a new chapter on research design, new topics (including weighted mean, resampling with the bootstrap, the role of the syntax file in workflow management, and regression to the mean), and new examples and exercises. Student learning is supported by a rich suite of online resources, including answers to end-of-chapter exercises, real data sets, PowerPoint slides, and a test bank. Avoids calculus and linear algebra and instead grounds concepts in real data examples to ensure simple and clear explanation. Written by highly experienced teachers. Chapter examples and exercises are based on real data, which enables students to understand what it truly means to be a data analys.
Statistics Using Stata
by Weinberg Sharon Lawner Abramowitz Sarah KnappEngaging and accessible to students from a wide variety of mathematical backgrounds, Statistics Using Stata combines the teaching of statistical concepts with the acquisition of the popular Stata software package. It closely aligns Stata commands with numerous examples based on real data, enabling students to develop a deep understanding of statistics in a way that reflects statistical practice. Capitalizing on the fact that Stata has both a menu-driven 'point and click' and program syntax interface, the text guides students effectively from the comfortable 'point and click' environment to the beginnings of statistical programming. Its comprehensive coverage of essential topics gives instructors flexibility in curriculum planning and provides students with more advanced material to prepare them for future work. Online resources - including complete solutions to exercises, PowerPoint slides, and Stata syntax (do-files) for each chapter - allow students to review independently and adapt codes to solve new problems, reinforcing their programming skills.
Statistics Using Technology
by Kathryn KozakThis is a statistics textbook to be used in an introductory statistics class. This book uses technology to calculate probabilities. The approach to this textbook is to ask people to interpret statistics and think statistically.
Statistics With Microsoft Excel (Fifth Edition)
by Beverly DretzkeStatistics with Microsoft Excel, Fifth Edition, shows readers how to use Microsoft Excel® to perform statistical analysis. This step-by-step guide has been updated to cover the new features and interface of Excel 2010. Datasets and other resources (where applicable) for this book are available here.
Statistics With R: Solving Problems Using Real-World Data
by Jenine K. HarrisDrawing on examples from across the social and behavioral sciences, Statistics with R: Solving Problems Using Real-World Data by Jenine K. Harris introduces foundational statistics concepts with beginner-friendly R programming in an exploration of the world&’s tricky problems faced by the &“R Team&” characters. Inspired by the programming group &“R Ladies,&” the R Team works together to master the skills of statistical analysis and data visualization to untangle real-world, messy data using R. The storylines draw students into investigating contemporary issues such as marijuana legalization, voter registration, and the opioid epidemic, and lead them step-by-step through full-color illustrations of R statistics and interactive exercises.
Statistics Without Tears: A Primer for Non-Mathematicians
by Derek RowntreeHelps readers understand what statistics is, and how to think statistically. It focuses on the ideas behind statistics only; readers are not required to perform any calculations.
Statistics Workbook For Dummies with Online Practice
by Deborah J. RumseyPractice your way to a higher statistics score The adage that "practice makes perfect" is never truer than with math problems. Statistics Workbook For Dummies with Online Practice provides succinct content reviews for every topic, with plenty of examples and practice problems for each concept, in the book and online. Every lesson begins with a concept review, followed by a few example problems and plenty of practice problems. There's a step-by-step solution for every problem, with tips and tricks to help with comprehension and retention. New for this edition, free online practice quizzes for each chapter provide extra opportunities to test your knowledge and understanding. Get FREE access to chapter quizzes in an online test bank Work along with each chapter or use the test bank for final exam review Discover which statistical measures are most meaningful Scoring high in your Statistics class has never been easier!
Statistics and Analysis of Scientific Data
by Massimiliano BonamenteStatistics and Analysis of Scientific Data covers the foundations of probability theory and statistics, and a number of numerical and analytical methods that are essential for the present-day analyst of scientific data. Topics covered include probability theory, distribution functions of statistics, fits to two-dimensional datasheets and parameter estimation, Monte Carlo methods and Markov chains. Equal attention is paid to the theory and its practical application, and results from classic experiments in various fields are used to illustrate the importance of statistics in the analysis of scientific data. The main pedagogical method is a theory-then-application approach, where emphasis is placed first on a sound understanding of the underlying theory of a topic, which becomes the basis for an efficient and proactive use of the material for practical applications. The level is appropriate for undergraduates and beginning graduate students, and as a reference for the experienced researcher. Basic calculus is used in some of the derivations, and no previous background in probability and statistics is required. The book includes many numerical tables of data, as well as exercises and examples to aid the students' understanding of the topic.
Statistics and Analysis of Scientific Data
by Massimiliano BonamenteThe revised second edition of this textbook provides the reader with a solid foundation in probability theory and statistics as applied to the physical sciences, engineering and related fields. It covers a broad range of numerical and analytical methods that are essential for the correct analysis of scientific data, including probability theory, distribution functions of statistics, fits to two-dimensional data and parameter estimation, Monte Carlo methods and Markov chains. Features new to this edition include: * a discussion of statistical techniques employed in business science, such as multiple regression analysis of multivariate datasets. * a new chapter on the various measures of the mean including logarithmic averages. * new chapters on systematic errors and intrinsic scatter, and on the fitting of data with bivariate errors. * a new case study and additional worked examples. * mathematical derivations and theoretical background material have been appropriately marked, to improve the readability of the text. * end-of-chapter summary boxes, for easy reference. As in the first edition, the main pedagogical method is a theory-then-application approach, where emphasis is placed first on a sound understanding of the underlying theory of a topic, which becomes the basis for an efficient and practical application of the material. The level is appropriate for undergraduates and beginning graduate students, and as a reference for the experienced researcher. Basic calculus is used in some of the derivations, and no previous background in probability and statistics is required. The book includes many numerical tables of data, as well as exercises and examples to aid the readers' understanding of the topic.
Statistics and Causality: Methods for Applied Empirical Research
by Alexander Von Eye Wolfgang WiedermannA one-of-a-kind guide to identifying and dealing with modern statistical developments in causality Written by a group of well-known experts, Statistics and Causality: Methods for Applied Empirical Research focuses on the most up-to-date developments in statistical methods in respect to causality. Illustrating the properties of statistical methods to theories of causality, the book features a summary of the latest developments in methods for statistical analysis of causality hypotheses. The book is divided into five accessible and independent parts. The first part introduces the foundations of causal structures and discusses issues associated with standard mechanistic and difference-making theories of causality. The second part features novel generalizations of methods designed to make statements concerning the direction of effects. The third part illustrates advances in Granger-causality testing and related issues. The fourth part focuses on counterfactual approaches and propensity score analysis. Finally, the fifth part presents designs for causal inference with an overview of the research designs commonly used in epidemiology. Statistics and Causality: Methods for Applied Empirical Research also includes: * New statistical methodologies and approaches to causal analysis in the context of the continuing development of philosophical theories * End-of-chapter bibliographies that provide references for further discussions and additional research topics * Discussions on the use and applicability of software when appropriate Statistics and Causality: Methods for Applied Empirical Research is an ideal reference for practicing statisticians, applied mathematicians, psychologists, sociologists, logicians, medical professionals, epidemiologists, and educators who want to learn more about new methodologies in causal analysis. The book is also an excellent textbook for graduate-level courses in causality and qualitative logic. Wolfgang Wiedermann, PhD, is Assistant Professor in the Department of Educational, School, and Counseling Psychology at the University of Missouri, Columbia. His research interests include the development of methods for direction dependence analysis and causal inference, the development and evaluation of methods for person-oriented research, and methods for intensive longitudinal data. Alexander von Eye, PhD, is Professor Emeritus of Psychology at Michigan State University. His research interests include statistical methods, categorical data analysis, and human development. Dr. von Eye is Section Editor for the Encyclopedia of Statistics in Behavioral Science and is the coauthor of Log-Linear Modeling: Concepts, Interpretation, and Application, both published by Wiley.
Statistics and Data Analysis for Engineers and Scientists (Transactions on Computer Systems and Networks)
by Tanvir Mustafy Md. Tauhid RahmanThis textbook summarizes the different statistical, scientific, and financial data analysis methods for users ranging from a high school level to a professional level. It aims to combine the data analysis methods using three different programs—Microsoft Excel, SPSS, and MATLAB. The book combining the different data analysis tools is a unique approach. The book presents a variety of real-life problems in data analysis and machine learning, delivering the best solution. Analysis methods presented in this book include but are not limited to, performing various algebraic and trigonometric operations, regression modeling, and correlation, as well as plotting graphs and charts to represent the results. Fundamental concepts of applied statistics are also explained here, with illustrative examples. Thus, this book presents a pioneering solution to help a wide range of students, researchers, and professionals learn data processing, interpret different findings derived from the analyses, and apply them to their research or professional fields. The book also includes worked examples of practical problems. The primary focus behind designing these examples is understanding the concepts of data analysis and how it can solve problems. The chapters include practice exercises to assist users in enhancing their skills to execute statistical analysis calculations using software instead of relying on tables for probabilities and percentiles in the present world.
Statistics and Data Analysis for Microarrays Using R and Bioconductor (Chapman & Hall/CRC Computational Biology Series)
by Sorin DraghiciRichly illustrated in color, Statistics and Data Analysis for Microarrays Using R and Bioconductor, Second Edition provides a clear and rigorous description of powerful analysis techniques and algorithms for mining and interpreting biological information. Omitting tedious details, heavy formalisms, and cryptic notations, the text takes a hands-on, example-based approach that teaches students the basics of R and microarray technology as well as how to choose and apply the proper data analysis tool to specific problems.New to the Second EditionCompletely updated and double the size of its predecessor, this timely second edition replaces the commercial software with the open source R and Bioconductor environments. Fourteen new chapters cover such topics as the basic mechanisms of the cell, reliability and reproducibility issues in DNA microarrays, basic statistics and linear models in R, experiment design, multiple comparisons, quality control, data pre-processing and normalization, Gene Ontology analysis, pathway analysis, and machine learning techniques. Methods are illustrated with toy examples and real data and the R code for all routines is available on an accompanying downloadable resource.With all the necessary prerequisites included, this best-selling book guides students from very basic notions to advanced analysis techniques in R and Bioconductor. The first half of the text presents an overview of microarrays and the statistical elements that form the building blocks of any data analysis. The second half introduces the techniques most commonly used in the analysis of microarray data.
Statistics and Data Analysis for Social Science
by Eric Jon KriegStatistics and Data Analysis for Social Science helps students to build a strong foundational understanding of statistics by providing clarity around when and why statistics useful. Rather than focusing on the “how to” of statistics, author Eric J. Krieg simplifies the complexity of statistical calculations by introducing only what is necessary to understanding each concept. Every chapter is written around and applied to a different social problem or issues—enabling students to broaden their imagination about the statistical “tools” that can be used to make sense of our world and, maybe, to make the world a better place.
