- Table View
- List View
Solving Numerical PDEs: Problems, Applications, Exercises
by Luca Formaggia Alessandro Veneziani Fausto SaleriThis book stems from the long standing teaching experience of the authors in the courses on Numerical Methods in Engineering and Numerical Methods for Partial Differential Equations given to undergraduate and graduate students of Politecnico di Milano (Italy), EPFL Lausanne (Switzerland), University of Bergamo (Italy) and Emory University (Atlanta, USA). It aims at introducing students to the numerical approximation of Partial Differential Equations (PDEs). One of the difficulties of this subject is to identify the right trade-off between theoretical concepts and their actual use in practice. With this collection of examples and exercises we try to address this issue by illustrating "academic" examples which focus on basic concepts of Numerical Analysis as well as problems derived from practical application which the student is encouraged to formalize in terms of PDEs, analyze and solve. The latter examples are derived from the experience of the authors in research project developed in collaboration with scientists of different fields (biology, medicine, etc.) and industry. We wanted this book to be useful both to readers more interested in the theoretical aspects and those more concerned with the numerical implementation.
Solving Optimization Problems with the Heuristic Kalman Algorithm: New Stochastic Methods (Springer Optimization and Its Applications #212)
by Rosario ToscanoThis text focuses on simple and easy-to-use design strategies for solving complex engineering problems that arise in several fields of engineering design, namely non-convex optimization problems. The main optimization tool used in this book to tackle the problem of nonconvexity is the Heuristic Kalman Algorithm (HKA). The main characteristic of HKA is the use of a stochastic search mechanism to solve a given optimization problem. From a computational point of view, the use of a stochastic search procedure appears essential for dealing with non-convex problems.The topics discussed in this monograph include basic definitions and concepts from the classical optimization theory, the notion of the acceptable solution, machine learning, the concept of preventive maintenance, and more. The Heuristic Kalman Algorithm discussed in this book applies to many fields such as robust structured control, electrical engineering, mechanical engineering, machine learning, reliability, and preference models. This large coverage of practical optimization problems makes this text very useful to those working on and researching systems design. The intended audience includes industrial engineers, postgraduates, and final-year undergraduates in various fields of systems design.
Solving Ordinary and Partial Boundary Value Problems in Science and Engineering (Applied and Computational Mechanics)
by Karel RektorysThis book provides an elementary, accessible introduction for engineers and scientists to the concepts of ordinary and partial boundary value problems, acquainting readers with fundamental properties and with efficient methods of constructing solutions or satisfactory approximations.Discussions include: ordinary differential equations classical theory of partial differential equations Laplace and Poisson equations heat equation variational methods of solution of corresponding boundary value problems methods of solution for evolution partial differential equations The author presents special remarks for the mathematical reader, demonstrating the possibility of generalizations of obtained results and showing connections between them. For the non-mathematician, the author provides profound functional-analytical results without proofs and refers the reader to the literature when necessary.Solving Ordinary and Partial Boundary Value Problems in Science and Engineering contains essential functional analytical concepts, explaining its subject without excessive abstraction.
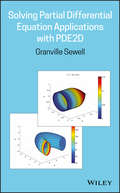
Solving Partial Differential Equation Applications with PDE2D
by Granville SewellSolve engineering and scientific partial differential equation applications using the PDE2D software developed by the author Solving Partial Differential Equation Applications with PDE2D derives and solves a range of ordinary and partial differential equation (PDE) applications. This book describes an easy-to-use, general purpose, and time-tested PDE solver developed by the author that can be applied to a wide variety of science and engineering problems. The equations studied include many time-dependent, steady-state and eigenvalue applications such as diffusion, heat conduction and convection, image processing, math finance, fluid flow, and elasticity and quantum mechanics, in one, two, and three space dimensions. The author begins with some simple "0D" problems that give the reader an opportunity to become familiar with PDE2D before proceeding to more difficult problems. The book ends with the solution of a very difficult nonlinear problem, which requires a moving adaptive grid because the solution has sharp, moving peaks. This important book: Describes a finite-element program, PDE2D, developed by the author over the course of 40 years Derives the ordinary and partial differential equations, with appropriate initial and boundary conditions, for a wide variety of applications Offers free access to the Windows version of the PDE2D software through the author’s website at www.pde2d.com Offers free access to the Linux and MacOSX versions of the PDE2D software also, for instructors who adopt the book for their course and contact the author at www.pde2d.com Written for graduate applied mathematics or computational science classes, Solving Partial Differential Equation Applications with PDE2D offers students the opportunity to actually solve interesting engineering and scientific applications using the accessible PDE2D.

Solving Polynomial Equation Systems: Algebraic Solving
by Teo MoraThis third volume of four finishes the program begun in Volume 1 by describing all the most important techniques, mainly based on Gröbner bases, which allow one to manipulate the roots of the equation rather than just compute them. <P><P>The book begins with the 'standard' solutions (Gianni–Kalkbrener Theorem, Stetter Algorithm, Cardinal–Mourrain result) and then moves on to more innovative methods (Lazard triangular sets, Rouillier's Rational Univariate Representation, the TERA Kronecker package). The author also looks at classical results, such as Macaulay's Matrix, and provides a historical survey of elimination, from Bézout to Cayley. This comprehensive treatment in four volumes is a significant contribution to algorithmic commutative algebra that will be essential reading for algebraists and algebraic geometers.
Solving Polynomial Equation Systems: Buchberger Theory and Beyond
by Teo MoraIn this fourth and final volume the author extends Buchberger's Algorithm in three different directions. First, he extends the theory to group rings and other Ore-like extensions, and provides an operative scheme that allows one to set a Buchberger theory over any effective associative ring. Second, he covers similar extensions as tools for discussing parametric polynomial systems, the notion of SAGBI-bases, Gröbner bases over invariant rings and Hironaka's theory. Finally, Mora shows how Hilbert's followers - notably Janet, Gunther and Macaulay - anticipated Buchberger's ideas and discusses the most promising recent alternatives by Gerdt (involutive bases) and Faugère (F4 and F5). This comprehensive treatment in four volumes is a significant contribution to algorithmic commutative algebra that will be essential reading for algebraists and algebraic geometers.
Solving Problems in Mathematical Analysis, Part I: Sets, Functions, Limits, Derivatives, Integrals, Sequences and Series (Problem Books in Mathematics)
by Tomasz RadożyckiThis textbook offers an extensive list of completely solved problems in mathematical analysis. This first of three volumes covers sets, functions, limits, derivatives, integrals, sequences and series, to name a few. The series contains the material corresponding to the first three or four semesters of a course in Mathematical Analysis.Based on the author’s years of teaching experience, this work stands out by providing detailed solutions (often several pages long) to the problems. The basic premise of the book is that no topic should be left unexplained, and no question that could realistically arise while studying the solutions should remain unanswered. The style and format are straightforward and accessible. In addition, each chapter includes exercises for students to work on independently. Answers are provided to all problems, allowing students to check their work.Though chiefly intended for early undergraduate students of Mathematics, Physics and Engineering, the book will also appeal to students from other areas with an interest in Mathematical Analysis, either as supplementary reading or for independent study.
Solving Problems in Mathematical Analysis, Part II: Definite, Improper and Multidimensional Integrals, Functions of Several Variables and Differential Equations (Problem Books in Mathematics)
by Tomasz RadożyckiThis textbook offers an extensive list of completely solved problems in mathematical analysis. This second of three volumes covers definite, improper and multidimensional integrals, functions of several variables, differential equations, and more. The series contains the material corresponding to the first three or four semesters of a course in Mathematical Analysis.Based on the author’s years of teaching experience, this work stands out by providing detailed solutions (often several pages long) to the problems. The basic premise of the book is that no topic should be left unexplained, and no question that could realistically arise while studying the solutions should remain unanswered. The style and format are straightforward and accessible. In addition, each chapter includes exercises for students to work on independently. Answers are provided to all problems, allowing students to check their work.Though chiefly intended for early undergraduate students of Mathematics, Physics and Engineering, the book will also appeal to students from other areas with an interest in Mathematical Analysis, either as supplementary reading or for independent study.
Solving Problems in Mathematical Analysis, Part III: Curves and Surfaces, Conditional Extremes, Curvilinear Integrals, Complex Functions, Singularities and Fourier Series (Problem Books in Mathematics)
by Tomasz RadożyckiThis textbook offers an extensive list of completely solved problems in mathematical analysis. This third of three volumes covers curves and surfaces, conditional extremes, curvilinear integrals, complex functions, singularities and Fourier series. The series contains the material corresponding to the first three or four semesters of a course in Mathematical Analysis.Based on the author’s years of teaching experience, this work stands out by providing detailed solutions (often several pages long) to the problems. The basic premise of the book is that no topic should be left unexplained, and no question that could realistically arise while studying the solutions should remain unanswered. The style and format are straightforward and accessible. In addition, each chapter includes exercises for students to work on independently. Answers are provided to all problems, allowing students to check their work.Though chiefly intended for early undergraduate students of Mathematics, Physics and Engineering, the book will also appeal to students from other areas with an interest in Mathematical Analysis, either as supplementary reading or for independent study.
Solving Problems in Thermal Engineering: A Toolbox for Engineers (Power Systems)
by Viktor Józsa Róbert KovácsThis book provides general guidelines for solving thermal problems in the fields of engineering and natural sciences.Written for a wide audience, from beginner to senior engineers and physicists, it provides a comprehensive framework covering theory and practice and including numerous fundamental and real-world examples. Based on the thermodynamics of various material laws, it focuses on the mathematical structure of the continuum models and their experimental validation. In addition to several examples in renewable energy, it also presents thermal processes in space, and summarizes size-dependent, non-Fourier, and non-Fickian problems, which have increasing practical relevance in, e.g., the semiconductor industry. Lastly, the book discusses the key aspects of numerical methods, particularly highlighting the role of boundary conditions in the modeling process.The book provides readers with a comprehensive toolbox, addressing a wide variety of topics in thermal modeling, from constructing material laws to designing advanced power plants and engineering systems.
Solving for Why: Understanding, Assessing, and Teaching Students Who Struggle With Math, Grades K-8
by John TapperSolving for Why offers educators the tools and guidance essential for successfully solving for why students struggle with mathematics. The step-by-step, RTI (Response to Intervention) – like approaches, focused on assessment and communication with students, help teachers gain insight into student understanding in a remarkably different way than recipe-type approaches that assume the same solution applies to learners with similar struggles.
Solving the Dynamic Complexity Dilemma
by Nabil Abu el Ata Maurice J. PerksDynamic complexity results from hidden, unknown factors--or more precisely, interactions between factors--that can unexpectedly impact the performance of systems. When the influences of dynamic complexity are not measured and understood, new never-seen-before behaviors can come as unwelcomed surprises, which disrupt the performance of systems. Left alone, processes that were once prized for their efficiency unexpectedly begin to degrade--costs increase, while volumes and quality decline. Evidence of problems may come too late for effective resolution as technology advancements induce rapid change and compress the time available to react to that change. The results of dynamic complexity are always negative and unmanaged dynamic complexity can bring business or global systems to the point of sudden chaos. The 2009 H1N1 pandemic, 2008 Credit Crunch and 2011 Fukushima Daiichi nuclear disaster are global examples of the dangers of undiagnosed dynamic complexity. With increasing frequency executive leaders today are discovering that their business and IT system performance levels are not meeting expectations. In most cases these performance deficiencies are caused by dynamic complexity, which lies hidden like a cancer until the symptoms reveal themselves--often when it is too late to avoid negative impacts on business outcomes. This book examines the growing business problem of dynamic complexity and presents a path to a practical solution. To achieve better predictability, organizations must be able to expose new, dangerous patterns of behavior in time to take corrective actions and know which actions will yield the optimal results. The book authors promote new methods of risk management that use data collection, analytics, machine learning and automation processes to help organizations more accurately predict the future and take strategic actions to improve performance outcomes. The presented means of achieving this goal are based upon the authors' practical experiences, backed by scientific principles, and results achieved through consulting engagements with over 350 global organizations.
Some Basic Theory for Statistical Inference: Monographs on Applied Probability and Statistics
by E.J.G. PitmanIn this book the author presents with elegance and precision some of the basic mathematical theory required for statistical inference at a level which will make it readable by most students of statistics.
Some Fundamentals of Mathematics of Blockchain
by Julien RiposoThis book provides a foundation for the mathematics of blockchain. It is inspired by a general analysis and synthesis of the current knowledge of blockchain technology and starts by laying a foundation for the mathematics of blockchain. The aim is for research in the area of blockchain to lead their study from the construction highlighted in this book.First, the basis of a blockchain is set: block, transaction contents, block header, Merkle tree, nonce, Proof-of-Work. Connections with elliptic curves and cryptographic signatures are made.Second, the book ties this with a Graph and Matrix Theories approach and models the peer-to-peer relationship through the Bitcoin Network.Third, it is proposed further modelling, notably around halving, optimal storing, or diffusion of information, which are consequences of the mathematical foundation. The notion of Entropy of Privacy and the Particles model are introduced.Finally, the mathematical statements therein are proven and essential reminders can be found before each section, so the content can be accessible from a graduate level.
Some Musings on Theta, Eta, and Zeta: From E8 to Cold Plasma to an lnhomogeneous Universe (Mathematical Physics Studies)
by Floyd L. WilliamsThis book continues the applications of mathematics, more specifically of theta, eta, and zeta functions, and modular forms, to various areas of theoretical physics. It is a follow-up and extension in some sense of the author’s earlier book entitled A window into zeta and modular physics. Some of the main topics are1. A new approach to logarithmic corrections to black hole entropy2. My recent work that provides for an explicit cold plasma-black hole connection3. Generalization of work of physicists on certain asymptotic problems relating to string theory, for example, by way of the general theory of modular forms of non-positive weight4. A construction of the E8 root lattice, its theta function, and its relevance for heterotic string theory5. Applications of elliptic functions to KdV, nonlinear Schrödinger, and Duffing equations, for example, including a discussion of Lax pairs and the Miura transformation6. Finite temperature zeta functions and partition functions for quantum fields in thermal equilibrium on various curved background spacetimes7. Exact solutions of the Einstein gravitational field equations for Lemaitre and inhomogeneous cosmological models, with a special focus on the Szekeres–Szafron exact solutions by way of the Weierstrass elliptic function8. Elementary particles and my zeta function formula for higher spin fermionic particles; this covers, in particular, the gravitino particle (of spin 3/2) and bosons with integral spin s = 2, 3, 4, 5.These are some sample topics. Others include the continuous Heisenberg model, reaction diffusion systems, Dirichlet and Hecke L-functions, the modular j-invariant, the computation of the one-loop effective potential for non-compact symmetric spaces, the BTZ black hole, Jacobi inversion formulas, etc.Thus, there is a very large range of material with the first 9 chapters of preliminary, expositional background for mathematicians and physicists.
Some Problems of Unlikely Intersections in Arithmetic and Geometry (Annals of Mathematics Studies #181)
by Umberto ZannierThis book considers the so-called Unlikely Intersections, a topic that embraces well-known issues, such as Lang's and Manin-Mumford's, concerning torsion points in subvarieties of tori or abelian varieties. More generally, the book considers algebraic subgroups that meet a given subvariety in a set of unlikely dimension. The book is an expansion of the Hermann Weyl Lectures delivered by Umberto Zannier at the Institute for Advanced Study in Princeton in May 2010. The book consists of four chapters and seven brief appendixes, the last six by David Masser. The first chapter considers multiplicative algebraic groups, presenting proofs of several developments, ranging from the origins to recent results, and discussing many applications and relations with other contexts. The second chapter considers an analogue in arithmetic and several applications of this. The third chapter introduces a new method for approaching some of these questions, and presents a detailed application of this (by Masser and the author) to a relative case of the Manin-Mumford issue. The fourth chapter focuses on the André-Oort conjecture (outlining work by Pila).

Some Topics in Algebra
by Michel BrouéDuring the springs of 2011 and 2012, the author was invited by Peking University to give an advanced undergraduate algebra course (once a week over two months each year). This book was written during and for that course. By no way does it claim to be too exhaustive. It was originally intended as a brief introduction to algebra for an extremely pleasant and passionate audience. It certainly reflects some of the author's own tastes, and it was influenced by the feelings and the reactions of the students. Nevertheless, the result covers some advanced undergraduate algebra (rings, ideals, basics of fields theory, algebraic integers, modules, hom and tensor functors, projective modules, etc. ) illustrated by numerous examples, counterexamples and exercises. Following a worldwide tradition, the author had planned to conclude by lecturing on the structure of finitely generated modules over principal ideal domains. But during the course, after explaining that the notion of projective modules is more natural than the notion of free modules, it became clear that principal ideal domains needed to be replaced by Dedekind rings; this is much less traditional in the literature -- but not more difficult.
Some Unusual Topics in Quantum Mechanics (Lecture Notes in Physics #1020)
by Pankaj SharanThis second edition of Some Unusual Topics in Quantum Mechanics builds upon the topics covered in the first, with additional chapters that delve deeper into the mathematical foundations of the subject. New topics include Hilbert spaces and unbounded operators, minimum uncertainty states, path integrals in general coordinates, Fock spaces, second quantization, relativistic particle states, and quantum fields. Historical insights are also included, such as a pre-history of matrix mechanics and Pauli's proof of the H-atom spectrum using O(4) symmetry. Finally, readers are introduced to Bell's inequality and the non-locality in quantum mechanics that is revealed through its violation. These topics are rarely covered in introductory textbooks but are crucial to developing a student's interest and deeper understanding of quantum mechanics. This book serves as valuable supporting material for graduate-level core courses on the subject.
Some Unusual Topics in Quantum Mechanics (SpringerBriefs in Physics)
by Pankaj SharanIn this book, the author addresses selected topics in quantum mechanics that are not usually covered in books, but which are very helpful in developing a student's interest in, and a deeper understanding of the subject. The topics include two different ways of looking at quantum mechanics; three clarifying topics that students often find confusing; one classic theorem never proved in the classroom; and a discussion on whether there can be a non-linear quantum mechanics. The book can be used as supporting material for graduate-level core courses on quantum mechanics.

Someday
by Liz HuyckAda dreams of becoming an inventor when she grows up. As she soon discovers, she is already looking for solutions to everyday problems.
Something Doesn't Add Up: Surviving Statistics in a Post-Truth World
by Paul GoodwinSome people fear and mistrust numbers. Others want to use them for everything. After a long career as a statistician, Paul Goodwin has learned the hard way that the ones who want to use them for everything are a very good reason for the rest of us to fear and mistrust them. Something Doesn't Add Up is a tour of the stupidest, self-defeating, self-blinding ways supposedly clever people use maths in everyday life.Wry, witty and humane, Goodwin explains mathematical subtleties so painlessly that you hardly need to think about numbers at all. He demonstrates how statistics that are meant to make life simpler often make it simpler than it actually is, but also reveals some of the ways we can use maths to make better decisions. Along the way we learn about fitness tracking, the history of IQ testing, China's social credit system, EffectiveAltruism, and how someone should have noticed that Harold Shipman was killing his patients years before they actually did. In the right hands, maths is a useful tool. It's just a pity there are so many of the wrong hands about.

Somewhere in the Ocean
by Jennifer Ward T. J. MarshA counting book in rhyme presents various marine animals and their children, from a mother manatee and her little calf one to a mother octopus and her little babies ten. Complete with a glossary, musical score, and numbers hidden in the illustrations.
Song of Two Worlds
by Alan LightmanIn Alan Lightman's new book, a verse narrative, we meet a man who has lost his faith in all things following a mysterious personal tragedy. After decades of living "hung like a dried fly," emptied and haunted by his past, the narrator awakens one morning revitalized and begins a Dante-like journey to find something to believe in, first turning to t
Sophie Germain: Revolutionary Mathematician (Springer Biographies)
by Dora MusielakThis biography of the mathematician, Sophie Germain, paints a rich portrait of a brilliant and complex woman, the mathematics she developed, her associations with Gauss, Legendre, and other leading researchers, and the tumultuous times in which she lived. Sophie Germain stood right between Gauss and Legendre, and both publicly recognized her scientific efforts. Unlike her female predecessors and contemporaries, Sophie Germain was an impressive mathematician and made lasting contributions to both number theory and the theories of plate vibrations and elasticity. She was able to walk with ease across the bridge between the fields of pure mathematics and engineering physics. Though isolated and snubbed by her peers, Sophie Germain was the first woman to win the prize of mathematics from the French Academy of Sciences. She is the only woman who contributed to the proof of Fermat’s Last Theorem. In this unique biography, Dora Musielak has done the impossible―she has chronicled Sophie Germain’s brilliance through her life and work in mathematics, in a way that is simultaneously informative, comprehensive, and accurate.

Sophie la girafe: Let's Get Counting! (Sophie la Girafe)
by DKIntroducing a new series of eBooks for Sophie la girafe, the much-loved children's toy!Sophie la girafe: Let's Get Counting! introduces babies to the world of numbers and counting with their favorite friend, Sophie la girafe.Filled with bright, playful images of Sophie and her pals, Sophie la girafe: Let's Get Counting! is ideal for encouraging early word and number recognition in young children. Count sweet cupcakes, cherries, ladybugs, and much more with Sophie la girafe in this delightful eBook. Introduce your baby to numbers and help develop their imaginations with Sophie la girafe!