- Table View
- List View
Stable Convergence and Stable Limit Theorems
by Erich Häusler Harald LuschgyThe authors present a concise but complete exposition of the mathematical theory of stable convergence and give various applications in different areas of probability theory and mathematical statistics to illustrate the usefulness of this concept. Stable convergence holds in many limit theorems of probability theory and statistics - such as the classical central limit theorem - which are usually formulated in terms of convergence in distribution. Originated by Alfred Rényi, the notion of stable convergence is stronger than the classical weak convergence of probability measures. A variety of methods is described which can be used to establish this stronger stable convergence in many limit theorems which were originally formulated only in terms of weak convergence. Naturally, these stronger limit theorems have new and stronger consequences which should not be missed by neglecting the notion of stable convergence. The presentation will be accessible to researchers and advanced students at the master's level with a solid knowledge of measure theoretic probability.
Stable Design Patterns for Software and Systems
by Mohamed FayadAttention to design patterns is unquestionably growing in software engineering because there is a strong belief that using made to measure solutions for solving frequently occurring problems encountered throughout the design phase greatly reduces the total cost and the time of developing software products. Stable Design Patterns for Software and Systems presents a new and fresh approach for creating stable, reusable, and widely applicable design patterns. It deals with the concept of stable design patterns based on software stability as a contemporary approach for building stable and highly reusable and widely applicable design patterns. This book shows that a formation approach to discovering and creating stable design patterns accords with Alexander’s current understanding of architectural patterns. Stable design patterns are a type of knowledge pattern that underline human problem solving methods and appeal to the pattern community. This book examines software design patterns with respect to four central themes: How do we develop a solution for the problem through software stability concepts? This book offers a direct application of using software stability concepts for modeling solutions. How do we achieve software stability over time and design patterns that are effective to use? What are the unique roles of stable design patterns in modeling the accurate solution of the problem at hand and in providing stable and undisputed design for such problems? This book enumerates a complete and domain-less list of stable patterns that are useful for designing and modeling solutions for frequently recurring problems. What is the most efficient way to document the stable design patters to ensure efficient reusability? This book is an extension to the contemporary templates that are used in documenting design patterns. This book gives a pragmatic and a novel approach toward understanding the problem domain and in proposing stable solutions for engineering stable software systems, components, and frameworks.
Stable Klingen Vectors and Paramodular Newforms (Lecture Notes in Mathematics #2342)
by Jennifer Johnson-Leung Brooks Roberts Ralf SchmidtThis book describes a novel approach to the study of Siegel modular forms of degree two with paramodular level. It introduces the family of stable Klingen congruence subgroups of GSp(4) and uses this family to obtain new relations between the Hecke eigenvalues and Fourier coefficients of paramodular newforms, revealing a fundamental dichotomy for paramodular representations. Among other important results, it includes a complete description of the vectors fixed by these congruence subgroups in all irreducible representations of GSp(4) over a nonarchimedean local field.Siegel paramodular forms have connections with the theory of automorphic representations and the Langlands program, Galois representations, the arithmetic of abelian surfaces, and algorithmic number theory. Providing a useful standard source on the subject, the book will be of interest to graduate students and researchers working in the above fields.
Stable Non-Gaussian Random Processes: Stochastic Models with Infinite Variance
by Gennady SamoradnitskyThis book serves as a standard reference, making this area accessible not only to researchers in probability and statistics, but also to graduate students and practitioners. The book assumes only a first-year graduate course in probability. Each chapter begins with a brief overview and concludes with a wide range of exercises at varying levels of difficulty. The authors supply detailed hints for the more challenging problems, and cover many advances made in recent years.
Stable Solutions of Elliptic Partial Differential Equations
by Louis DupaigneStable solutions are ubiquitous in differential equations. They represent meaningful solutions from a physical point of view and appear in many applications, including mathematical physics (combustion, phase transition theory) and geometry (minimal surfaces). Stable Solutions of Elliptic Partial Differential Equations offers a self-contained presentation of the notion of stability in elliptic partial differential equations (PDEs). The central questions of regularity and classification of stable solutions are treated at length. Specialists will find a summary of the most recent developments of the theory, such as nonlocal and higher-order equations. For beginners, the book walks you through the fine versions of the maximum principle, the standard regularity theory for linear elliptic equations, and the fundamental functional inequalities commonly used in this field. The text also includes two additional topics: the inverse-square potential and some background material on submanifolds of Euclidean space.
Stagnant Dreamers: How the Inner City Shapes the Integration of the Second Generation
by Maria G. RendonA quarter of young adults in the U.S. today are the children of immigrants, and Latinos are the largest minority group. In Stagnant Dreamers, sociologist and social policy expert María Rendón follows 42 young men from two high-poverty Los Angeles neighborhoods as they transition into adulthood. Based on in-depth interviews and ethnographic observations with them and their immigrant parents, Stagnant Dreamers describes the challenges they face coming of age in the inner city and accessing higher education and good jobs, and demonstrates how family-based social ties and community institutions can serve as buffers against neighborhood violence, chronic poverty, incarceration, and other negative outcomes. Neighborhoods in East and South Central Los Angeles were sites of acute gang violence that peaked in the 1990s, shattering any romantic notions of American life held by the immigrant parents. Yet, Rendón finds that their children are generally optimistic about their life chances and determined to make good on their parents’ sacrifices. Most are strongly oriented towards work. But despite high rates of employment, most earn modest wages and rely on kinship networks for labor market connections. Those who made social connections outside of their family and neighborhood contexts, more often found higher quality jobs. However, a middle-class lifestyle remains elusive for most, even for college graduates. Rendón debunks fears of downward assimilation among second-generation Latinos, noting that most of her subjects were employed and many had gone on to college. She questions the ability of institutions of higher education to fully integrate low-income students of color. She shares the story of one Ivy League college graduate who finds himself working in the same low-wage jobs as his parents and peers who did not attend college. Ironically, students who leave their neighborhoods to pursue higher education are often the most exposed to racism, discrimination, and classism. Rendón demonstrates the importance of social supports in helping second-generation immigrant youth succeed. To further the integration of second-generation Latinos, she suggests investing in community organizations, combating criminalization of Latino youth, and fully integrating them into higher education institutions. Stagnant Dreamers presents a realistic yet hopeful account of how the Latino second generation is attempting to realize its vision of the American dream.
Stalking the Riemann Hypothesis: The Quest to Find the Hidden Law of Prime Numbers
by Dan RockmoreLike a hunter who sees 'a bit of blood' on the trail, is how Princeton mathematician Peter Sarnak describes the feeling of chasing an idea that seems to have a chance of success. If this is so, then the jungle of abstractions that is maths is full of frenzied hunters these days. They are out stalking big game: the resolution of 'The Riemann Hypothesis', seems to be in their sights. The Riemann Hypothesis is about the prime numbers, the fundamental numerical elements. Stated in 1859 by Prof Bernhard Riemann, it proposes a simple law which he believed a 'very likely' explanation for the way in which the primes are distributed among the whole numbers, indivisible stars scattered without end throughout a boundless numerical universe. Just 8 years later, at the tender age of 39 Riemann would be dead from TB, cheated of the opportunity to settle his conjecture. For over a century, the Riemann Hypothesis has stumped the greatest of mathematical minds, but these days frustration has begun to give way to excitement. This unassuming comment is revealing astounding connections among nuclear physics, chaos and number theory, creating a frenzy of intellectual excitement amplified by the recent promise of a one million dollar bounty. The story of the quest to settle the Riemann Hypothesis is one of scientific exploration. It is peopled with solitary hermits and gregarious cheerleaders, cool calculators and wild-eyed visionaries, Nobel Prize-winners and Fields Medalists. To delve into the Riemann Hypothesis is to gain a window into the world of modern maths and the nature of maths research. Stalking the Riemann Hypothesis will open wide this window so that all may gaze through it in amazement.
Standard Deviations: Flawed Assumptions, Tortured Data, and Other Ways to Lie with Statistics
by Gary SmithHow statistical data is used, misused, and abused every day to fool us: “A very entertaining book about a very serious problem.” —Robert J. Shiller, winner of the Nobel Prize in Economics and author of Irrational ExuberanceDid you know that baseball players whose names begin with “D” are more likely to die young? That Asian Americans are most susceptible to heart attacks on the fourth day of the month? That drinking a full pot of coffee every morning adds years to your life, but one cup a day increases your pancreatic cancer risk? These “facts” have been argued with a straight face by credentialed researchers and backed up with reams of data and convincing statistics. As Nobel Prize–winning economist Ronald Coase cynically observed, “If you torture data long enough, it will confess.” Lying with statistics is a time-honored con. In Standard Deviations, economics professor Gary Smith walks us through the various tricks and traps that people use to back up their own crackpot theories. Sometimes, the unscrupulous deliberately try to mislead us. Other times, the well-intentioned are blissfully unaware of the mischief they are committing. Today, data is so plentiful that researchers spend precious little time distinguishing between good, meaningful indicators and total rubbish. Not only do others use data to fool us, we fool ourselves. Drawing on breakthrough research in behavioral economics and using clear examples, Standard Deviations demystifies the science behind statistics and makes it easy to spot the fraud all around us.“An entertaining primer . . . packed with figures, tables, graphs and ludicrous examples from people who know better (academics, scientists) and those who don’t (political candidates, advertisers).” —Kirkus Reviews (starred review)
Standard Level Mathematics: Developed Specifically For The IB Diploma
by Ibrahim Wazir Tim GarryWritten for the 2012 syllabus, this is the 2nd edition of the highly regarded 1st edition used successfully by teachers worldwide.
Standard Model Phenomenology
by Shaaban Khalil Stefano MorettiThis new book is fully up to date with all the latest developments on both theoretical and experimental investigations of the Standard Model (SM) of particle physics with a particular emphasis on its historical development on both sides. It further stresses the cross-fertilisation between the two sub-disciplines of theoretical and experimental particle physics which has been instrumental in establishing the SM. In other words, the book develops a truly phenomenological attitude to the subject. In addition to emphasising the successes of the SM, this book also critically assesses its limitations and raises key unanswered questions for the purpose of presenting a new perspective of how to further our knowledge above and beyond it. It also contains both historical information from past experiments and latest results from the Large Hadron Collider at CERN.This book will be an invaluable reference to advanced undergraduate and postgraduate students, in addition to early-stage researchers in the field.Key Features: Provides a unique approach not found in current literature in developing and verifying the SM Presents the theory pedagogically but rigorously from basic knowledge of quantum field theory Brings together experimental and theoretical practice in one, cohesive text
Standards, Emergence, and Complex Outcomes: The Missing Link between Cause and Effect
by D. Linda GarciaStandards, Emergence, and Complex Outcomes redefines how we think about standards, framing them as interfaces that govern interactions and connect causes to their effects. Expanding beyond traditional technical and geopolitical discussions, Garcia introduces a fresh theoretical perspective that positions standards as central to understanding complexity. From food safety and workplace regulations to standardized parts in manufacturing and our reliance on technology, standards shape nearly every aspect of modern life.By proposing a multidimensional approach, Garcia argues that standards are the mechanisms driving change, complexity is the backdrop for this change, emergence is the process by which change unfolds, and evolution is its ultimate outcome. Each chapter explores key elements of complexity theory and supports them with compelling historical and empirical examples, providing a richly detailed narrative that deepens understanding.This book is an essential resource for academics and students across the social sciences, policymakers shaping standards-dependent fields, and professionals in industries where standards dictate progress. Whether you're exploring the intersections of technology, governance, and complexity or looking to better navigate the systems shaping our world, this book offers vital insights into the pivotal role of standards in our increasingly interconnected society.
Standards-based School Mathematics Curricula: What Are They? What Do Students Learn? (Studies in Mathematical Thinking and Learning Series)
by Denisse R. Thompson Sharon L. SenkThe Curriculum and Evaluation Standards for School Mathematics published by the National Council of Teachers of Mathematics in 1989 set forth a broad vision of mathematical content and pedagogy for grades K-12 in the United States. These Standards prompted the development of Standards-based mathematics curricula. What features characterize Standards-based curricula? How well do such curricula work? To answer these questions, the editors invited researchers who had investigated the implementation of 12 different Standards-based mathematics curricula to describe the effects of these curricula on students' learning and achievement, and to provide evidence for any claims they made. In particular, authors were asked to identify content on which performance of students using Standards-based materials differed from that of students using more traditional materials, and content on which performance of these two groups of students was virtually identical. Additionally, four scholars not involved with the development of any of the materials were invited to write critical commentaries on the work reported in the other chapters. Section I of Standards-Based School Mathematics Curricula provides a historical background to place the current curriculum reform efforts in perspective, a summary of recent recommendations to reform school mathematics, and a discussion of issues that arise when conducting research on student outcomes. Sections II, III, and IV are devoted to research on mathematics curriculum projects for elementary, middle, and high schools, respectively. The final section is a commentary by Jeremy Kilpatrick, Regents Professor of Mathematics Education at the University of Georgia, on the research reported in this book. It provides a historical perspective on the use of research to guide mathematics curriculum reform in schools, and makes additional recommendations for further research. In addition to the references provided at the end of each chapter, other references about the Standards-based curriculum projects are provided at the end of the book. This volume is a valuable resource for all participants in discussions about school mathematics curricula--including professors and graduate students interested in mathematics education, curriculum development, program evaluation, or the history of education; educational policy makers; teachers; parents; principals and other school administrators. The editors hope that the large body of empirical evidence and the thoughtful discussion of educational values found in this book will enable readers to engage in informed civil discourse about the goals and methods of school mathematics curricula and related research.
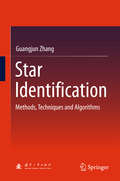
Star Identification
by Guangjun ZhangThis book summarizes the research advances in star identification that the author's team has made over the past 10 years, systematically introducing the principles of star identification, general methods, key techniques and practicable algorithms. It also offers examples of hardware implementation and performance evaluation for the star identification algorithms. Star identification is the key step for celestial navigation and greatly improves the performance of star sensors, and as such the book include the fundamentals of star sensors and celestial navigation, the processing of the star catalog and star images, star identification using modified triangle algorithms, star identification using star patterns and using neural networks, rapid star tracking using star matching between adjacent frames, as well as implementation hardware and using performance tests for star identification. It is not only valuable as a reference book for star sensor designers and researchers working in pattern recognition and other related research fields, but also as teaching resource for senior postgraduate and graduate students majoring in information processing, computer science, artificial intelligence, aeronautics and astronautics, automation and instrumentation. Dr. Guangjun Zhang is a professor at the School of Instrumentation Science and Opto-electronics Engineering, Beihang University, China and also the Vice President of Beihang University, China
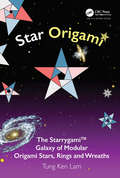
Star Origami: The Starrygami™ Galaxy of Modular Origami Stars, Rings and Wreaths (AK Peters/CRC Recreational Mathematics Series)
by Tung Ken Lam"Star Origami is a festival of folding fun that is sure to inspire. Tung Ken's stellar designs are rich with invention, and as always, his works are beautifully illustrated and written by him. Those eager for the math behind the designs will not be disappointed."— Michael LaFosse (Origamido® Studio), author of over 50 origami books including Geometric Origami: The Art of Modular Paper Sculpture "Tung Ken Lam is one of the world’s leading exponents of modular origami design. His books never disappoint."— David Mitchell, author of Mathematical Origami and founder of origamiheaven.com "Perfect for teachers to guide students to explore the relationships between the properties of rectangles and the folded stars. The curious and motivated student will find hours of mathematical buried treasure through folding."– Charlene Morrow, Director, SummerMath, Mount Holyoke College and Past Board Chair, OrigamiUSA "Star Origami provides a treasure trove of relevant math foundations, and suggestive pathways for the creative journey. It has already stimulated new directions for my own star structures."— Arnold Tubis, author of Unfolding Mathematics with Origami Boxes and Tessellation Inspired Origami Box Designs Star Origami: The Starrygami™ Galaxy of Modular Origami Stars, Rings and Wreaths is an exciting collection of origami rings, stars and wreaths made using the modular technique, including clear instructions for making them. Features Over sixty paper stars, all made without cutting, gluing or decorating using the modular origami technique Hundreds of clear step-by-step instructions show you how, based on the technique of folding a small number of simple units and joining them together as a satisfying puzzle Secret tips to make new shapes just by varying a few lengths and angles Suitable for teaching and learning art, geometry and mathematics. Teachers will appreciate the practical advice to succeed in using origami for education.
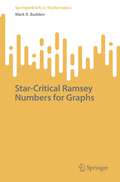
Star-Critical Ramsey Numbers for Graphs (SpringerBriefs in Mathematics)
by Mark R. BuddenThis text is a comprehensive survey of the literature surrounding star-critical Ramsey numbers. First defined by Jonelle Hook in her 2010 dissertation, these numbers aim to measure the sharpness of the corresponding Ramsey numbers by determining the minimum number of edges needed to be added to a critical graph for the Ramsey property to hold. Despite being in its infancy, the topic has gained significant attention among Ramsey theorists.This work provides researchers and students with a resource for studying known results and their complete proofs. It covers typical results, including multicolor star-critical Ramsey numbers for complete graphs, trees, cycles, wheels, and n-good graphs, among others. The proofs are streamlined and, in some cases, simplified, with a few new results included. The book also explores the connection between star-critical Ramsey numbers and deleted edge numbers, which focus on destroying the Ramsey property by removing edges.The book concludes with open problems and conjectures for researchers to consider, making it a valuable resource for those studying the field of star-critical Ramsey numbers.
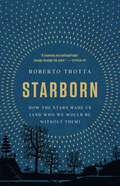
Starborn: How the Stars Made Us (and Who We Would Be Without Them)
by Roberto TrottaAn astronomer "who writes like a poet" (Wall Street Journal) gives a sweeping, "beautifully written" (Nature) inquiry into how the night sky has shaped human history For as long as humans have lived, we have lived beneath the stars. But under the glow of today&’s artificial lighting, we have lost the intimacy our ancestors once shared with the cosmos. In Starborn, cosmologist Roberto Trotta reveals how stargazing has shaped the course of human civilization. The stars have served as our timekeepers, our navigators, our muses—they were once even our gods. How radically different would we be, Trotta also asks, if our ancestors had looked up to the night sky and seen… nothing? He pairs the history of our starstruck species with a dramatic alternate version, a world without stars where our understanding of science, art, and ourselves would have been radically altered. Revealing the hidden connections between astronomy and civilization, Starborn summons us to the marvelous sight that awaits us on a dark, clear night—to lose ourselves in the immeasurable vastness above.
Starry Reckoning: Reference and Analysis in Mathematics and Cosmology
by Emily Rolfe GrosholzThis book deals with a topic that has been largely neglected by philosophers of science to date: the ability to refer and analyze in tandem. On the basis of a set of philosophical case studies involving both problems in number theory and issues concerning time and cosmology from the era of Galileo, Newton and Leibniz up through the present day, the author argues that scientific knowledge is a combination of accurate reference and analytical interpretation. In order to think well, we must be able to refer successfully, so that we can show publicly and clearly what we are talking about. And we must be able to analyze well, that is, to discover productive and explanatory conditions of intelligibility for the things we are thinking about. The book's central claim is that the kinds of representations that make successful reference possible and those that make successful analysis possible are not the same, so that significant scientific and mathematical work typically proceeds by means of a heterogeneous discourse that juxtaposes and often superimposes a variety of kinds of representation, including formal and natural languages as well as more iconic modes. It demonstrates the virtues and necessity of heterogeneity in historically central reasoning, thus filling an important gap in the literature and fostering a new, timely discussion on the epistemology of science and mathematics.
Start Programming Using HTML, CSS, and JavaScript (Chapman & Hall/CRC Textbooks in Computing)
by Iztok FajfarThis text is a manual for undergraduate students in engineering and the natural sciences to discover how computer programming works. Using a dialog format between two students and a professor, the text teaches students how the mainstream web languages HTML, CSS, and JavaScript interact and how to harness their capabilities in practical settings. Each chapter focuses on a specific theme supported by a gradual development of engaging worked examples of live web documents and applications using the three languages.
Starthilfe Finanzmathematik: Zinsen – Kurse – Renditen (Studienbücher Wirtschaftsmathematik)
by Bernd LudererDiese Starthilfe zur Finanzmathematik vermittelt die grundlegenden Formeln, Methoden und Ideen der klassischen Finanzmathematik, ohne allzu sehr ins Detail zu gehen und so, dass man mit durchschnittlichen mathematischen Schulkenntnissen dem Text gut folgen kann. Das inhaltliche Kernstück bilden Zins- und Zinseszinsrechnung, Rentenrechnung, Tilgungsrechnung und Kursrechnung. Auch verwandte Gebiete wie Abschreibungen und Investitionsrechnung werden aus mathematischer Sicht behandelt. Komplettiert wird der Band durch einen Ausblick auf aktuelle Fragestellungen aus dem Investment Banking. Eine Vielzahl praktischer Beispiele macht das Buch interessant und anschaulich. Zu Beginn eines jeden Kapitels finden sich explizit formulierte Lernziele sowie typische Problemstellungen, zu denen am Kapitelende Lösungen angegeben sind. Für die vorliegende 5. Auflage wurden kleinere Korrekturen und Aktualisierungen vorgenommen sowie 130 digitale Flashcards ergänzt, mit denen der eigene Lernerfolg überprüft werden kann. Dazu ist einfach die Springer-Nature-Flashcards-App herunterzuladen.
Starting Statistics: A Short, Clear Guide
by Neil BurdessStatistics: A Short, Clear Guide is an accessible, humorous and easy introduction to statistics for social science students. In this refreshing book, experienced author and academic Neil Burdess shows that statistics are not the result of some mysterious "black magic", but rather the result of some very basic arithmetic. Getting rid of confusing x′s and y′s, he shows that it′s the intellectual questions that come before and after the calculations that are important: (i) What are the best statistics to use with your data? and (ii) What do the calculated statistics tell you? Statistics: A Short, Clear Guide aims to help students make sense of the logic of statistics and to decide how best to use statistics to analyse their own data. What′s more, it is not reliant on students having access to any particular kind of statistical software package. This is a very useful book for any student in the social sciences doing a statistics course or needing to do statistics for themselves for the first time.
Stat-Spotting
by Joel BestDoes a young person commit suicide every thirteen minutes in the United States? Are four million women really battered to death by their husbands or boyfriends each year? Is methamphetamine our number one drug problem today? Alarming statistics bombard our daily lives, appearing in the news, on the Web, seemingly everywhere. But all too often, even the most respected publications present numbers that are miscalculated, misinterpreted, hyped, or simply misleading. This new edition contains revised benchmark statistics, updated resources, and a new section on the rhetorical uses of statistics, complete with new problems to be spotted and new examples illustrating those problems. Joel Best's best seller exposes questionable uses of statistics and guides the reader toward becoming a more critical, savvy consumer of news, information, and data. Entertaining, informative, and concise, Stat-Spotting takes a commonsense approach to understanding data and doesn't require advanced math or statistics.
Stat2: Building models for a World of Data
by George W. Cobb Allan J. Rossman Jeffrey A. Witmer Ann R. Cannon Bradley A. Hartlaub Julie M. Legler Robin H. Lock Thomas L. MooreSTAT2 offers students who have taken AP Statistics or a typical introductory statistics college level course to learn more sophisticated concepts and the tools with which to apply them. <P> The authors' primary goal is to help students gain facility in the use of common statistical models. The text instructs students on working with models where the response variable is either quantitative or categorical and predictors (or explanatory factors) are quantitative or categorical (or both). The chapters are grouped to consider models based on the type of response and type of predictors. <P> After completing a course with STAT2 students should be able to: 1. Choose the appropriate statistical model for a particular problem. 2. Know the conditions that are typically required when fitting various models. 3. Assess whether or not the conditions for a particular model are reasonably met for a specific dataset. 4. Have some strategies for dealing with data when the conditions for a standard model are not met. 5. Use the appropriate model to make appropriate inferences.
State Estimation for Robotics
by Timothy D. BarfootA key aspect of robotics today is estimating the state, such as position and orientation, of a robot as it moves through the world. Most robots and autonomous vehicles depend on noisy data from sensors such as cameras or laser rangefinders to navigate in a three-dimensional world. This book presents common sensor models and practical advice on how to carry out state estimation for rotations and other state variables. It covers both classical state estimation methods such as the Kalman filter, as well as important modern topics such as batch estimation, the Bayes filter, sigmapoint and particle filters, robust estimation for outlier rejection, and continuous-time trajectory estimation and its connection to Gaussian-process regression. The methods are demonstrated in the context of important applications such as point-cloud alignment, pose-graph relaxation, bundle adjustment, and simultaneous localization and mapping. Students and practitioners of robotics alike will find this a valuable resource.

State Space Consistency and Differentiability
by Demetrios SerakosBy investigating the properties of the natural state, this book presents an analysis of input-output systems with regard to the mathematical concept of state. The state of a system condenses the effects of past inputs to the system in a useful manner. This monograph emphasizes two main properties of the natural state; the first has to do with the possibility of determining the input-output system from its natural state set and the second deals with differentiability properties involving the natural state inherited from the input-output system, including differentiability of the natural state and natural state trajectories. The results presented in this title aid in modeling physical systems since system identification from a state set holds in most models. Researchers and engineers working in electrical, aerospace, mechanical, and chemical fields along with applied mathematicians working in systems or differential equations will find this title useful due to its rigorous mathematics.
State Space Grids
by Tom HollensteinHuman development from birth through adulthood is a complex interplay of many interacting forces. Children's internal processes are manifest in behaviors that are sculpted by their experiences, most notably with primary caregivers. Because the discipline of psychology explores human behavior and cognition, the techniques employed for developmental analysis must be able to describe, depict, and quantify these complex processes. State Space Grids provides the framework, basic method, rationale, and advanced techniques for translating the behavior of children, adolescents, and parents into visible, traceable data. This seminar-between-covers takes readers step by step from conceptualization through implementation of projects, with examples from a range of current research within and outside child development. Links are included for the GridWare software program and related user resources. And although state space grids need not be used only to analyze dynamic systems, they serve as an excellent tool for honing systemic thinking. Key coverage in this volume includes: Dynamic systems and the origins of state space grids. The state of research using state space grids. Introducing GridWare and how it works. How to use state space grids, from idea through finished project. Within-grid and between-grid analysis. Conducting advanced analysis. State Space Grids is an essential reference for researchers across such disciplines as psychology, neuroscience, economics, computer science, and agricultural science.