- Table View
- List View
Speculative Communities: Living with Uncertainty in a Financialized World
by Aris Komporozos-AthanasiouSpeculative Communities investigates the financial world’s influence on the social imagination, unraveling its radical effects on our personal and political lives. In Speculative Communities, Aris Komporozos-Athanasiou examines the ways that speculation has moved beyond financial markets to shape fundamental aspects of our social and political lives. As ordinary people make exceptional decisions, such as the American election of a populist demagogue or the British vote to leave the European Union, they are moving from time-honored and -tested practices of governance, toward the speculative promise of a new, more uncertain future. This book shows how even our methods of building community have shifted to the speculative realm as social media platforms enable and amplify our volatile wagers. For Komporozos-Athanasiou, “to speculate” means increasingly “to connect,” to endorse the unknown pre-emptively, and often daringly, as a means of social survival. Grappling with the question of how more uncertainty can lead to its full-throated embrace rather than dissent, Speculative Communities shows how finance has become the model for society writ large. As Komporozos-Athanasiou argues, virtual marketplaces, new social media, and dating apps bring finance’s opaque infrastructures into the most intimate realms of our lives, leading to a new type of speculative imagination across economy, culture, and society.
Speculative Everything: Design, Fiction, and Social Dreaming
by Anthony Dunne Fiona RabyHow to use design as a tool to create not only things but ideas, to speculate about possible futures.Today designers often focus on making technology easy to use, sexy, and consumable. In Speculative Everything, Anthony Dunne and Fiona Raby propose a kind of design that is used as a tool to create not only things but ideas. For them, design is a means of speculating about how things could be—to imagine possible futures. This is not the usual sort of predicting or forecasting, spotting trends and extrapolating; these kinds of predictions have been proven wrong, again and again. Instead, Dunne and Raby pose “what if” questions that are intended to open debate and discussion about the kind of future people want (and do not want).Speculative Everything offers a tour through an emerging cultural landscape of design ideas, ideals, and approaches. Dunne and Raby cite examples from their own design and teaching and from other projects from fine art, design, architecture, cinema, and photography. They also draw on futurology, political theory, the philosophy of technology, and literary fiction. They show us, for example, ideas for a solar kitchen restaurant; a flypaper robotic clock; a menstruation machine; a cloud-seeding truck; a phantom-limb sensation recorder; and devices for food foraging that use the tools of synthetic biology. Dunne and Raby contend that if we speculate more—about everything—reality will become more malleable. The ideas freed by speculative design increase the odds of achieving desirable futures.
Speculative Geographies: Ethics, Technologies, Aesthetics
by Thomas Keating Nina WilliamsThis book explores how speculative thinking is shaping how we relate to our entangled social, mental, and environmental ecologies. It examines how speculative philosophies and concepts are changing geographical research methods and techniques, whilst also developing how speculative thinking transforms the way human, non-human, and more-than-human things are conceptualised in research practices across the social sciences, arts, and humanities. Offering the first dedicated compendium of geographical engagements with speculation and speculative thinking, the chapters in this edited collection advance debates about how affective, imperceptible, and infra-sensible qualities of environments might be written about through alternative registers and ontologies of experience. Organised around the themes of Ethics, Technologies, and Aesthetics, the book will appeal to those engaging with architecture, Black political theory, fiction, cinema, children’s geographies, biotechnologies, philosophy, rural studies, arts practice, and nuclear waste studies as speculative research practices appropriate for addressing contemporary ecological problems.Chapters 1, 3 and 4 are available open access under a Creative Commons Attribution 4.0 International License via link.springer.com.
Speculative Research: The Lure of Possible Futures (CRESC)
by Martin Savransky Alex Wilkie Marsha RosengartenIs another future possible? So called ‘late modernity’ is marked by the escalating rise in and proliferation of uncertainties and unforeseen events brought about by the interplay between and patterning of social–natural, techno–scientific and political-economic developments. The future has indeed become problematic. The question of how heterogeneous actors engage futures, what intellectual and practical strategies they put into play and what the implications of such strategies are, have become key concerns of recent social and cultural research addressing a diverse range of fields of practice and experience. Exploring questions of speculation, possibilities and futures in contemporary societies, Speculative Research responds to the pressing need to not only critically account for the role of calculative logics and rationalities in managing societal futures, but to develop alternative approaches and sensibilities that take futures seriously as possibilities and that demand new habits and practices of attention, invention, and experimentation.

Speech Communities
by Marcyliena H. MorganWhat makes a speech community? How do they evolve? How are speech communities identified? Speech communities are central to our understanding of how language and interactions occur in societies around the world and in this book readers will find an overview of the main concepts and critical arguments surrounding how language and communication styles distinguish and identify groups. Speech communities are not organized around linguistic facts but around people who want to share their opinions and identities; the language we use constructs, represents and embodies meaningful participation in society. This book focuses on a range of speech communities, including those that have developed from an increasing technological world where migration and global interactions are common. Essential reading for graduate students and researchers in linguistic anthropology, sociolinguistics and applied linguistics.
Speech Rate, Pause, and Sociolinguistic Variation
by Tyler KendallThis book provides a fascinating account of the psycholinguistic and social factors behind variation in speech timing in US English. With detailed discussions of its methods and data, it also acts as a valuable model for conducting corpus (socio)phonetic research.
Speech and Language Disorders in Children: Implications for the Social Security Administration’s Supplemental Security Income Program
by Engineering Medicine National Academies of SciencesSpeech and language are central to the human experience; they are the vital means by which people convey and receive knowledge, thoughts, feelings, and other internal experiences. Acquisition of communication skills begins early in childhood and is foundational to the ability to gain access to culturally transmitted knowledge, organize and share thoughts and feelings, and participate in social interactions and relationships. Thus, speech disorders and language disorders--disruptions in communication development--can have wide-ranging and adverse impacts on the ability to communicate and also to acquire new knowledge and fully participate in society. Severe disruptions in speech or language acquisition have both direct and indirect consequences for child and adolescent development, not only in communication, but also in associated abilities such as reading and academic achievement that depend on speech and language skills. The Supplemental Security Income (SSI) program for children provides financial assistance to children from low-income, resource-limited families who are determined to have conditions that meet the disability standard required under law. Between 2000 and 2010, there was an unprecedented rise in the number of applications and the number of children found to meet the disability criteria. The factors that contribute to these changes are a primary focus of this report. Speech and Language Disorders in Children provides an overview of the current status of the diagnosis and treatment of speech and language disorders and levels of impairment in the U.S. population under age 18. This study identifies past and current trends in the prevalence and persistence of speech disorders and language disorders for the general U.S. population under age 18 and compares those trends to trends in the SSI childhood disability population.

Speechless: The Erosion of Free Expression in the American Workplace
by Bruce BarryA factory worker is fired because her boss disagrees with her political bumper sticker. A stockbroker feels pressure to resign from an employer who disapproves of his off-hours political advocacy. A flight attendant is grounded because her airline doesn't like what she's writing in her personal blog. Is it legal to fire people for speech that makes employers uncomfortable, even if the content has little or nothing to do with their job or workplace? For most American workers, the alarming answer is yes. Speechless takes on the state of free expression in the American workplace, exploring its history, explaining how and why Americans have come to take freedom of speech for granted, and demonstrating how employers can legally punish employees for speaking their minds. Bruce Barry shows how constitutional law erects formidable barriers to free speech in workplaces, while employment law gives employers wide latitude to suppress speech with impunity--even speech that is unrelated to the job or the company. Employers, with rights of property ownership over not just what they manage but how they manage, can decide just how much employee speech they will tolerate. Workers have little choice but to accept conditions of employment or go elsewhere. Barry argues that a toxic combination of law, conventional economic wisdom, and accepted managerial practice has created an American workplace in which freedom of speech--that most crucial of civil liberties in a healthy democracy--is something you do after work, on your own time, and even then (for many), only if your employer approves. Barry proposes changes both to the law and to management practice that would expand employees' expressive rights without jeopardizing the legitimate interests of employers. In defense of freer speech in and around the workplace, Barry argues that a healthy democracy depends in part on the experience of liberty at work. Workplaces are key venues for shared experience and public discourse, so workplace speech rights matter deeply for advancing citizenship, community, and democracy in a free society.

Speed Reading Made Easy
by Nila Banton SmithSPEED READING IS A GIFT THAT YOU CAN GIVE TO YOURSELFYou may know people who are able to read a newspaper in a few minutes, flip through yet thoroughly absorb a book in an hour, or effortlessly finish skimming a report before you even suspected they were done. Quite possibly you have thought that these people were born with a natural talent for speed reading that you do not possess.Nothing could be further from the truth.Speed reading actually consists of a series of simple skills that can be mastered and applied by anyone willing to take the short time and minimal effort needed to master these so-called “secrets” and “tricks.” Now they are no longer either secret or tricky—but completely comprehensible and available in the finest speed reading guide on the market today—SPEED READING MADE EASY“Readable and persuasive.”—Cleveland Plain Dealer“An excellent, self-improvement manual...by a specialist.”—Los Angeles Times“Examples and self-applicable tests are provided every step of the way...Even the reader who thinks his speed and grasp adequate will benefit.”—Saturday Review Syndicate“It is possible for anybody to read faster with increased pleasure and profit.”—San Francisco Call-Bulletin
Speed Tribes: Days and Nights with Japan's Next Generation
by Karl Taro GreenfeldReports on Japanese youth culture in the early '90's, using particular people as examples. Includes stories of Yakuza gangsters, a motorcycle gang member, a teenage thief, a porn star, a rock band, a party girl, a bar hostess, a drug-dealer, an ultra-nationalist activist, a high-school dropout, a college student, and a computer hacker.
Speed of Purpose: Achieve 2.8X Productivity and Beyond
by Mark ThienesSpeed of Purpose delivers a powerful step-by-step process to achieve 2.8x productivity gains. This is a must-read, and must-implement, book for every aspiring top-performing team and organization! SPEED OF PURPOSE is launched with the th
Speed-Based Target Profit: Planning and Developing Synchronous Profitable Operations
by Alin PosteucăProfitable production planning is and will remain an eternal challenge to ensuring the prosperity and dignity of companies in a global market. Even though there are different approaches to achieving the target profitability through productivity in the production planning stage, these approaches do not guarantee consistent planning, creation, and sustenance of synchronous profitable operations for multiannual and annual target profit. In feedback to this predicament, Alin Posteucă develops a new system called speed-based target profit (SBTP). SBTP is the profitable production management and manufacturing improvement system that approaches production planning to achieve unit speed of target profit for target products through manufacturing cost improvement and bottleneck profitability control for maximum takt time. Managers and practitioners within manufacturing companies will discover a practical approach for cost down and cash up by applying a powerful operational profitable production planning formula to meet profitability expectations through productivity based on strong leadership with the help of a specific system for feedforward, concurrent, and feedback control. Therefore, the SBTP system in this book presents a holistic approach to profitability for target products and the development of its own mechanism since the acceptance of each order from customers to achieve continuous synchronization of all manufacturing processes to market requirements, profitability management, and profitable production planning. The uniqueness of the book is reinforced by a detailed presentation of the successful application of the SBTP system in two case studies, as a way of life and a unit speed of target profit improvement ethos at all hierarchical levels, in two multinational manufacturing companies operating in highly competitive markets in order to address the synchronous profitable operations for both the sales increase scenario and the sales decrease scenario. By adopting the SBTP system, your company will be able to consistently achieve unit speed of target profit in the bottleneck process for fulfilling annual and multiannual target profit as a unique and effective way through a new profitable production planning paradigm that operates according to its own production system.
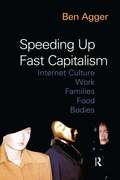
Speeding Up Fast Capitalism: Cultures, Jobs, Families, Schools, Bodies
by Ben AggerIn his 1989 book, Fast Capitalism, Ben Agger presented a framework for understanding late-20th century social problems. Speeding Up Fast Capitalism, a sequel to his earlier book, assesses social changes since the end of the 1980s brought about by information technologies like the Internet, which have quickened the pace of everyday life. In Speeding Up Fast Capitalism, Agger assesses the impact of the Internet on consciousness, communication, culture and community, and evaluates the prospects of democratic social change. Where the earlier book was largely theoretical, Speeding Up applies critical theory to specific topics such as Internet culture, work, families, childhood, schooling, food, the body and fitness. Although indebted to Fast Capitalism, the sequel appeals to an audience wider than theorists, including empirical sociologists, social scientists and scholars in cultural disciplines.

Spelend begeleiden van kinderen in het ziekenhuis: Het werk van de pedagogisch medewerker (Werken in SPH)
by A.J. Ravelli M. Magnee B. Fontaine M.J. van Deutekom Dineke Behrend G.C.C. van HeesDit cahier gaat over kinderen in het ziekenhuis, zieke kinderen dus, en over de bijzondere situatie waarin zij en hun ouders zich bevinden. Ziekte kan instabiliteit veroorzaken in het systeem van het gezin en de opvoedingsrelatie die ouders met hun kinderen hebben. Ziekte kan onzekerheid teweegbrengen bij kinderen en ouders. Er kan opvoedingsverlegenheid, opvoedingsspanning of opvoedingsonzekerheid ontstaan, zodanig dat er zelfs sprake kan zijn van een problematische opvoedingssituatie. In dit boekje wordt ingegaan op de specifieke rol die de pedagogisch medewerker heeft in het ondersteunen van ouders en kinderen in het ziekteproces en het omgaan met de ziekenhuisopname. De pedagogisch medewerker begeleidt het kind en geeft pedagogische adviezen aan zowel de ouders als aan ziekenhuismedewerkers. Naast ontspannings- en afleidingstechnieken is spel hierbij een van de belangrijkste middelen die zij gebruikt bij de begeleiding van de opgenomen kinderen.

Spellbound: Seven Principles of Illusion to Captivate Audiences and Unlock the Secrets of Success
by David KwongA professional magician and illusionist—the head magic consultant for the hit film Now You See Me—reveals how to bridge the gap between perception and reality to increase your powers of persuasion and influence.David Kwong has astounded corporate CEOs, TED talk audiences, and thousands of other hyper-rational people, making them see, believe, and even remember what he wants them to. Illusion is an ancient art that centers on control: commanding a room, building anticipation, and appearing to work wonders. Illusion works because the human brain is wired to fill the gap between seeing and believing. Successful leaders—like Steve Jobs, Warren Buffett, and Ted Turner—are masters of control and command who understand how to sway opinions and achieve goals.In his years of research and practice, David has discovered seven fundamental principles of illusion. With these rules anyone can learn to:Mind the Gap—recognize and employ the perceptual space between your audience’s ability to see and their impulse to believe.Load Up—prepare to amaze your audience.Write the Script—discover the importance of shaping the narrative that surrounds your illusion.Control the Frame—explore the real life value of a magician’s best friend: misdirection.Design Free Choice—command your audience by giving them agency.Employ the Familiar—take secret advantage of habits, patterns, and audience expectations.Conjure an Out—develop backup plans that will keep you one, two, three, or more steps ahead of the competition.With Spellbound you’ll discover a different way to sell your idea, product, or skills, and make your best shot better than everyone else’s.
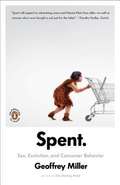
Spent: Sex, Evolution, and Consumer Behavior
by Geoffrey MillerA leading evolutionary psychologist probes the unconscious instincts behind American consumer culture Illuminating the hidden reasons for why we buy what we do, Spent applies evolutionary psychology to the sensual wonderland of marketing and perceived status that is American consumer culture. Geoffrey Miller starts with the theory that we purchase things to advertise ourselves to others, and then examines other factors that dictate what we spend money on. With humor and insight, Miller analyzes an array of product choices and deciphers what our decisions say about ourselves, giving us access to a new way of understanding-and improving-our behaviors to become happier consumers. .
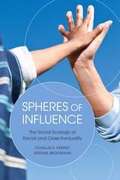
Spheres of Influence: The Social Ecology of Racial and Class Inequality
by Douglas S. Massey Stefanie BrodmannThe black-white divide has long haunted the United States as a driving force behind social inequality. Yet, the civil rights movement, the increase in immigration, and the restructuring of the economy in favor of the rich over the last several decades have begun to alter the contours of inequality. Spheres of Influence, co-authored by noted social scientists Douglas S. Massey and Stefanie Brodmann, presents a rigorous new study of the intersections of racial and class disparities today. Massey and Brodmann argue that despite the persistence of potent racial inequality, class effects are drastically transforming social stratification in America. This data-intensive volume examines the differences in access to material, symbolic, and emotional resources across major racial groups. The authors find that the effects of racial inequality are exacerbated by the class differences within racial groups. For example, when measuring family incomes solely according to race, Massey and Brodmann found that black families’ average income measured $28,400, compared to Hispanic families’ $35,200. But this gap was amplified significantly when class differences within each group were taken into account. With class factored in, inequality across blacks’ and Hispanics’ family incomes increased by a factor of almost four, with lower class black families earning an average income of only $9,300 compared to $97,000 for upper class Hispanics. Massey and Brodmann found similar interactions between class and racial effects on the distribution of symbolic resources, such as occupational status, and emotional resources, such as the presence of a biological father—across racial groups. Although there are racial differences in each group’s access to these resources, like income, these disparities are even more pronounced once class is factored in. The complex interactions between race and class are apparent in other social spheres, such as health and education. In looking at health disparities across groups, Massey and Brodmann observed no single class effect on the propensity to smoke cigarettes. Among whites, cigarette smoking declined with rising class standing, whereas among Hispanics it increased as class rose. Among Asians and blacks, there was no class difference at all. Similarly, the authors found no single effect of race alone on health: Health differences between whites, Asians, Hispanics, and blacks were small and non-significant in the upper class, but among those in the lower class, intergroup differences were pronounced. As Massey and Brodmann show, in the United States, a growing kaleidoscope of race-class interactions has replaced pure racial and class disadvantages. By advancing an ecological model of human development that considers the dynamics of race and class across multiple social spheres, Spheres of Influence sheds important light on the factors that are currently driving inequality today.

Spheres of Justice: A Defense of Pluralism and Equality
by Michael WalzerThe distinguished political philosopher and author of the widely acclaimed Just and Unjust Wars analyzes how society distributes not just wealth and power but other social "goods" like honor, education, work, free time--even love.
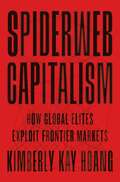
Spiderweb Capitalism: How Global Elites Exploit Frontier Markets
by Kimberly Kay HoangA behind-the-scenes look at how the rich and powerful use offshore shell corporations to conceal their wealth and make themselves richerIn 2015, the anonymous leak of the Panama Papers brought to light millions of financial and legal documents exposing how the superrich hide their money using complex webs of offshore vehicles. Spiderweb Capitalism takes you inside this shadow economy, uncovering the mechanics behind the invisible, mundane networks of lawyers, accountants, company secretaries, and fixers who facilitate the illicit movement of wealth across borders and around the globe.Kimberly Kay Hoang traveled more than 350,000 miles and conducted hundreds of in-depth interviews with private wealth managers, fund managers, entrepreneurs, C-suite executives, bankers, auditors, and other financial professionals. She traces the flow of capital from offshore funds in places like the Cayman Islands, Samoa, and Panama to special-purpose vehicles and holding companies in Singapore and Hong Kong, and how it finds its way into risky markets onshore in Vietnam and Myanmar. Hoang reveals the strategies behind spiderweb capitalism and examines the moral dilemmas of making money in legal, financial, and political gray zones.Dazzlingly written, Spiderweb Capitalism sheds critical light on how global elites capitalize on risky frontier markets, and deepens our understanding of the paradoxical ways in which global economic growth is sustained through states where the line separating the legal from the corrupt is not always clear.

Spielarten des politischen Konsums: Vom Boykott zum Buykotting
by Carolin V. ZorellDieses Buch bietet eine Analyse der Politik des Konsums und zeigt, wie der "gebildete Verbraucher" eine entscheidende Rolle bei der Förderung verantwortungsvoller Marktpraktiken und des Konsums spielt. Auf der Grundlage einer umfassenden interdisziplinären Perspektive untersucht es das Ausmaß, die Triebkräfte und die Verbindungen von Boykott, Kaufboykott, Kennzeichnungssystemen und sozialer Verantwortung von Unternehmen (CSR) in 20 europäischen Ländern. Eine zentrale Frage ist, ob makro-gesellschaftliche Orientierungsmuster hinsichtlich der Rolle des Staates, der Unternehmen und der Bürger individuelle und länderübergreifende Unterschiede beim Boykottieren und beim Kaufverbot erklären können. Wie das Buch zeigt, gibt es nicht nur einen Typus des "politischen Verbrauchers", sondern mehrere, und ihr Auftreten steht in direktem Zusammenhang mit nationalen Variationen von Kennzeichnungssystemen und der sozialen Verantwortung von Unternehmen. Die Verbraucher brauchen Anhaltspunkte und Informationen über die politischen Hintergründe ihrer Einkäufe, und die politischen Entscheidungsträger müssen diesem Bedarf durch politische Maßnahmen Rechnung tragen, die den nationalen Mustern in den Ansichten über Zusammenarbeit und Marktbeziehungen entsprechen.

Spielen ist unwahrscheinlich: Eine Theorie der ludischen Aktion
by Hans-Jürgen Arlt Fabian ArltBegründet und entfaltet wird ein Begriff des Spiels, der sich um Lockungen und Drohungen des Unerwarteten dreht. Das Autorenduo ordnet seine Theorie der ludischen Aktion in klassische Konzepte des Spiels ein sowie in den aktuellen Diskurs der Game Studies. Die phänomenale Mannigfaltigkeit des Spiels wird in historischer Perspektive skizziert und in systematischer Weise gegliedert. Die Autoren erläutern medientechnische und kommunikative Voraussetzungen des Booms der Computerspiele und reflektieren die Diskussion über Eskalationen ludischer Gewalt. Kritisch ausgeleuchtet werden Instrumentalisierungen des Spiels, die sich unter dem Stichwort Gamification wachsender Beliebtheit erfreuen. Die auffällige Inflation der Spielmetapher wird in Zusammenhang gebracht mit ludischen Anmutungen in den sozialen Strukturen der modernen und digitalen Gesellschaft.Fabian Arlt, M. A., hat Medienmanagement studiert und promoviert im Studiengang Gesellschafts- und Wirtschaftskommunikation der Universität der Künste (UdK) in Berlin.Prof. Dr. Hans-Jürgen Arlt ist Sozialwissenschaftler und Publizist, er lehrt am Institut für Theorie und Praxis der Kommunikation der Universität der Künste (UdK) in Berlin.

Spielräume des Affektiven: Konzeptionelle und exemplarische Studien zur frühneuzeitlichen Affektkultur
by Kai Bremer Andrea Grewe Meike RühlDer Band eröffnet interdisziplinäre Zugriffe auf die Dynamik affektiver Normen und Normierungen in der Frühen Neuzeit. Welchen Normen war affektives Handeln unterworfen? Gab es geschlechterspezifische Unterschiede, die die Spielräume des Affektiven und die Möglichkeiten, diese zu verändern, prägten? Wie wurden diese Spielräume gesellschaftlich konnotiert und in den Künsten thematisiert? Diese und verwandte Fragen werden konzeptionell und exemplarisch mit Beiträgen aus Theologie, Philosophie, Literatur-, Musik-, Kunst- und Geschichtswissenschaft behandelt.

Spin Fluctuation Theory of Itinerant Electron Magnetism
by Yoshinori TakahashiThis volume shows how collective magnetic excitations determine most of the magnetic properties of itinerant electron magnets. Previous theories were mainly restricted to the Curie-Weiss law temperature dependence of magnetic susceptibilities. Based on the spin amplitude conservation idea including the zero-point fluctuation amplitude, this book shows that the entire temperature and magnetic field dependence of magnetization curves, even in the ground state, is determined by the effect of spin fluctuations. It also shows that the theoretical consequences are largely in agreement with many experimental observations. The readers will therefore gain a new comprehensive perspective of their unified understanding of itinerant electron magnetism.