- Table View
- List View
The Methodological Dilemma: Creative, critical and collaborative approaches to qualitative research
by Kathleen GallagherThis thought-provoking book challenges the way research is planned and undertaken and equips researchers with a variety of creative and imaginative solutions to the dilemmas of method and representation that plague qualitative research. Fascinating and inspiring reading for any researcher in the Social Sciences this comprehensive collection encourages the reader to imagine the world in evermore complex and interesting ways and discover new routes to understanding. Some of the most influential figures in educational research consider questions such as: How does a socio-political context change the course of our research? What counts as a ‘truthful account’ in qualitative research? How do the voices of theory and the voices of ‘research subjects’ struggle to be heard in our research narratives? How can qualitative researchers ethically navigate the difficult terrain of research relationships? How is the material body rendered in qualitative research? Each chapter reveals a range of troubling dilemmas related to the critical aspects of research methodology in the Social Sciences and uses an illustrative case to elucidate the issues encountered by the researcher. Each writer brings a fierce philosophical spirit to her work, showing how methods or techniques of data-gathering grow from the theory and analysis of how research proceeds. A range of topics are addressed in a cross-disciplinary approach which will appeal to all scholars of qualitative research, undergraduate students in education programs and graduate students in a range of disciplines
The Methodology and Philosophy of Collective Writing: An Educational Philosophy and Theory Reader Volume X (Educational Philosophy and Theory: Editor’s Choice)
by Michael A. Peters Marek Tesar Tina Besley Liz Jackson Petar Jandric Sonja Arndt Sean SturmThis multi-authored collection covers the methodology and philosophy of collective writing. It is based on a series of articles written by the authors in Educational Philosophy and Theory; Open Review of Educational Research and Knowledge Cultures to explore the concept of collective writing. This tenth volume in the Editor's Choice series provides insights into the philosophy of academic writing and peer review, peer production, collective intelligence, knowledge socialism, openness, open science and intellectual commons. This collection represents the development of the philosophy, methodology and philosophy of collective writing developed in the last few years by members of the Editors’ Collective, (EC) who also edit, review and contribute to Educational Philosophy and Theory (EPAT) and to PESA Agora, edited by Tina Besley and Access, edited by Nina Hood, two PESA ‘journals’ recently developed by EC members. This book develops the philosophy, methodology and pedagogy of collective writing as a new mode of academic writing as an alternative to the normal academic article. The philosophy of collective writing draws on a new mode of academic publishing that emphasises the metaphysics of peer production and open review along with the main characteristics of openness, collaboration, co-creation and co-social innovation, peer review and collegiality that have become a praxis for the self-reflection emphasising the subjectivity of writing, sometimes called self-writing. This collection, under the EPAT series Editor’s Choice, draws on a group of members of the Editors’ Collective,who constitute a network of editors, reviewers and authors who established the organisation to further the aims of innovation in academic writing and publishing. It provides discussion and examples of the philosophy, methodology and pedagogy of collective writing. Split into three sections: Introduction, Openness and Projects, this volume offers an introduction to the philosophy and methodology of collective writing. It will be of interest to scholars in philosophy of education and those interested in the process of collective writing.
The Metrics of Happiness: The Art and Science of Measuring Personal Happiness and Societal Wellbeing (Social Indicators Research Series #86)
by R. Allan FreezeThis book provides a comprehensive treatment of how happiness and wellbeing are measured. It presents an accessible summary of the philosophy, methodology, and applicability of the various measurement techniques that have been generated by the leaders of the happiness movement. It traces the history of development of the core ideas, and clarifies the unexpectedly wide range of techniques that are used. The book provides an unbiased assessment of the strengths and weaknesses of each approach and differentiates the contributions that have been made by psychologists, economists, environmentalists, and health scientists. It examines applications at a personal scale, in the workplace, at a societal scale, and on the world stage. It does so in an easy-to-read anecdotal writing style that will appeal to a wide range of academic and lay readers who enjoy popularized non-fiction that address matters of social concern.
The Metropolis in Black and White: Place, Power and Polarization
by George C. GalsterThe Metropolis in Black and White highlights a stark fact: America's metropolitan areas are more polarized along racial lines than at any time since the mid-1960s. Though urban areas have become multicultural, the editors argue that black-white racial differences will outlast ethnic differences in metropolitan America and that the race issue in most urban areas is perceived as a black-white one. Galster and Hill perceive that the theme of place, power, and polarization is most powerful when blacks and whites are contrasted. African Americans, on average, are the poorest, most segregated, most disadvantaged urban racial (or ethnic) group, because they are deeply entangled in the web of interrelationships connecting place, power, and polarization. Since these interrelationships form a comprehensive set of social structures that oppress African Americans, they can be judged to be racist at their core. Race, not merely class, continues to play a pivotal role in shaping urban African Americans. In clear analyses, the contributors examine employment, income, the underclass, education, housing, health and mortality, political participation, and racial politics. Intertwined themes of spatial isolation, political empowerment, and racial disparities-place, power, and polarization-guide the analyses. Thisis a vital text for courses in urban affairs, American studies, economics, geography, sociology, political science, urban planning, and racial and ethnic studies. In clear analyses, the contributors examine employment, income, the underclass, education, housing, health and mortality, political participation, and racial politics. Intertwined themes of spatial isolation, political empowerment, and racial disparities-place, power, and polarization-guide the analyses. This is a vital text for courses in urban affairs, American studies, economics, geography, sociology, political science, urban planning, and racial and ethnic studies.
The Metropolitan Academic Medical Center: Its Role In An Era Of Tight Money And Changing Expectations
by Eli Ginzberg David E. RogersThe Metropolitan Academic Medical Center provides a careful reexamination of developments of the past decade, offers insights for improving medical education, biomedical research, and health care services, and examines the fate of the medical academy.
The Metropolitan Airport
by Nicholas Dagen BloomJohn F. Kennedy International Airport is one of New York City's most successful and influential redevelopment projects. Built and defined by outsize personalities--Mayor Fiorello La Guardia, famed urban planner Robert Moses, and Port Authority Executive Director Austin Tobin among them--JFK was fantastically expensive and unprecedented in its scale. By the late 1940s, once-polluted marshlands had become home to one of the world's busiest and most advanced airfields. Almost from the start, however, environmental activists in surrounding neighborhoods and suburbs clashed with the Port Authority. These fierce battles in the long term restricted growth and, compounded by lackluster management and planning, diminished JFK's status and reputation. Yet the airport remained a key contributor to metropolitan vitality: New Yorkers bound for adventure and business still boarded planes headed to distant corners of the globe, billions of tourists and immigrants came and went, and mammoth air cargo facilities bolstered the region's commerce.In The Metropolitan Airport, Nicholas Dagen Bloom chronicles the untold story of JFK International's complicated and turbulent relationship with the New York City metropolitan region. In spite of its reputation for snarled traffic, epic delays, endless construction, and abrasive employees, the airport was a key player in shifting patterns of labor, transportation, and residence; the airport both encouraged and benefited from the dispersion of population and economic activity to the outer boroughs and suburbs. As Bloom shows, airports like JFK are vibrant parts of their cities and powerfully influence urban development. The Metropolitan Airport is an indispensable book for those who wish to understand the revolutionary impact of airports on the modern American city.
The Mexican Outsiders: A Community History of Marginalization and Discrimination in California
by Martha MenchacaA Community History of Marginalization and Discrimination in California
The Mexican Outsiders: A Community History of Marginalization and Discrimination in California
by Martha MenchacaPeople of Mexican descent and Anglo Americans have lived together in the U. S. Southwest for over a hundred years, yet relations between them remain strained, as shown by recent controversies over social services for undocumented aliens in California. In this study, covering the Spanish colonial period to the present day, Martha Menchaca delves deeply into interethnic relations in Santa Paula, California, to document how the residential, social, and school segregation of Mexican-origin people became institutionalized in a representative California town. Menchaca lived in Santa Paula during the 1980s, and interviews with residents add a vivid human dimension to her book. She argues that social segregation in Santa Paula has evolved into a system of social apartness-that is, a cultural system controlled by Anglo Americans that designates the proper times and places where Mexican-origin people can socially interact with Anglos. This first historical ethnographic case study of a Mexican-origin community will be important reading across a spectrum of disciplines, including anthropology, sociology, race and ethnicity, Latino studies, and American culture.
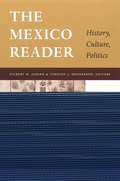
The Mexico Reader: History, Culture, Politics (The Latin America Readers)
by Gilbert M. Joseph Timothy J. HendersonThe Mexico Reader is a vivid introduction to muchos Méxicos—the many Mexicos, or the many varied histories and cultures that comprise contemporary Mexico. Unparalleled in scope and written for the traveler, student, and expert alike, the collection offers a comprehensive guide to the history and culture of Mexico—including its difficult, uneven modernization; the ways the country has been profoundly shaped not only by Mexicans but also by those outside its borders; and the extraordinary economic, political, and ideological power of the Roman Catholic Church. The book looks at what underlies the chronic instability, violence, and economic turmoil that have characterized periods of Mexico’s history while it also celebrates the country’s rich cultural heritage. A diverse collection of more than eighty selections, The Mexico Reader brings together poetry, folklore, fiction, polemics, photoessays, songs, political cartoons, memoirs, satire, and scholarly writing. Many pieces are by Mexicans, and a substantial number appear for the first time in English. The Mexico Reader explores what it means to be Mexican, tracing the history of Mexico from pre-Columbian times through the country’s epic revolution (1910–17) to the present day. The materials relating to the latter half of the twentieth century focus on the contradictions and costs of postrevolutionary modernization, the rise of civil society, and the dynamic cross-cultural zone marked by the two thousand-mile Mexico-U.S. border. The editors have divided the book into several sections organized roughly in chronological order and have provided brief historical contexts for each section. They have also furnished a lengthy list of resources about Mexico, including websites and suggestions for further reading.
The Micro-Politics of the School: Towards a Theory of School Organization (Routledge Library Editions: Education)
by Stephen J. BallStephen Ball’s micro-political theory of school organization is a radical departure from traditional theories. He rejects a prescriptive ‘top down’ approach and directly addresses the interest and concerns of teachers and current problems facing schools. In doing so he raises question about the adequacy and appropriateness of the existing forms of organizational control in schools. Through case studies and interviews with teachers, the book captures the flavour of real conflicts in schools – particularly in times of falling rolls, change of leadership or amalgamations – when teachers’ autonomy seems to be at stake.
The Microanalysis of Political Communication: Claptrap and Ambiguity (Routledge Research International Series in Social Psychology #Vol. 7)
by Peter BullThis analysis of political speeches and televised political interviews in the UK, based on the Annual Party Conferences (1996-2000) and the last five general elections (1983-2001), evaluates the interview skills of politicians and political interviewers, investigates how and why politicians equivocate and handle interruptions and examines the nature of applause, both invited and uninvited, in political speeches.
The Microeconomics of Market Failures
by Bernard SalaniéIn this book Bernard Salanie studies situations where competitive markets fail to achieve a collective optimum and the interventions used to remedy these so-called market failures. He includes discussions of theories of collective decision making, as well as elementary models of public economics and industrial organization. Although public economics is traditionally defined as the positive and normative study of government action over the economy, Salanie confines himself to microeconomic aspects of welfare economics; he considers taxation and the effects of public spending only as potential remedies for market failures. He concludes with a discussion of the theory of general equilibrium in incomplete markets.
The Micropolitics of Knowledge: Communication and Indirect Control in Workgroups (Communication & Social Order)
by Emmanuel LazegaFor many years Emmanuel Lazega has explored communication behavior and decision-making processes of small workgroups within larger organizations. To account for the knowledge claims of members of those groups, and for the ways in which such claims are legitimated collectively and translated into action, he presents a theory of the interactive elaboration of information on which decisions are based.
The Microsoft Story: How the Tech Giant Rebooted Its Culture, Upgraded Its Strategy, and Found Success in the Cloud (The Business Storybook Series)
by Dan GoodImagine?if you could see the playbook that returned a struggling tech empire to the top of the tech leaderboard.?The Microsoft Story?will help you understand and adopt the competitive strategies, workplace culture, and daily business practices that enabled the tech company to become a leading tech innovator once again.It wasn&’t so long ago that Microsoft and its Windows operating system dominated the tech industry so much so that they faced antitrust charges for what was perceived by many to be predatory, monopolistic practices. Less than a decade later, the tide had turned and Microsoft lost its dominance in the personal tech marketplace amidst the launch of the iPhone, the rise of Google, and the cloud computing phenomenon.But, now, Microsoft is back on top. The company&’s value is soaring and once again Microsoft is being recognized as a tech leader once again. What changed?The company culture has become one of creativity and innovation, no longer requiring that all products revolve around Windows. The company has reevaluated their business lines, getting rid of underperforming initiatives such as smartphones, and focused on the area of growth where the company excelled: the cloud.Through the story of Microsoft, you&’ll learn:How to build a nimble company culture that supports innovation and growth.How to return a forgotten brand to the spotlight.How to recognize and build upon successful business lines, while letting go of underperforming initiatives.When to change the entire?way?you do business.Discover how this iconic organization got it right and created a successful long-lasting business, and how you can do the same for your company.
The Middle Class in Emerging Societies: Consumers, Lifestyles and Markets (Routledge Research in Cultural and Media Studies)
by Leslie L. Marsh Hongmei LiThis volume examines the discursive construction of the meanings and lifestyle practices of the middle class in the rapidly transforming economies of Asia, Latin America, Africa and the Middle East, focusing on the social, political and cultural implications at local and global levels. While drawing a comparative analysis of what it means to be middle class in these different locations, the essays offer a connective understanding of the middle class phenomenon in emerging market economies and lay the groundwork for future research on emerging, transitional societies. The book addresses three key dimensions: the discursive creation of the middle class, the construction of the cultural identity through consumption practices and lifestyle choices, and the social, political and cultural consequences related to globalization and neoliberalism.
The Middle Class in Neo-Urban India: Space, Class and Distinction
by Smriti SinghThis book critically examines the new middle class and the emergence of neo-urban spaces in India within the context of rapid urbanisation and changing socio-spatial dynamics in urban areas in the country. It looks at class as a socio-spatial category where class distinction is tied to and manifests itself through the space of the city. With a detailed ethnographic study of the national capital region of Delhi, especially Gurugram, it explores themes such as class subjectivity, morality and social beliefs; life inside gated enclaves; family and everyday practices of class reproduction; and the process of othering and exclusivity, among others. Class identity, vulnerability and hierarchy influence the actions and motivations of the middle class. The author studies the nuances and socio-political fractures stemming from the complex dynamic of class, caste, religion and gender that manifest in these neo-urban spaces and how these shape the city and community. Rich in empirical resources, this book will be of interest to scholars and researchers of sociology, political sociology, ethnography, urban sociology, urban studies and South Asian studies.
The Middle Class in World Society: Negotiations, Diversities and Lived Experiences
by Christian Suter B. P. Vani S. MadheswaranThis volume delves into the study of the world’s emerging middle class. With essays on Europe, the United States, Africa, Latin America, and Asia, the book studies recent trends and developments in middle class evolution at the global, regional, national, and local levels. It reconsiders the conceptualization of the middle class, with a focus on the diversity of middle class formation in different regions and zones of world society. It also explores middle class lifestyles and everyday experiences, including experiences of social mobility, feelings of insecurity and anxiety, and even middle class engagement with social activism. Drawing on extensive fieldwork and in-depth interviews, the book provides a sophisticated analysis of this new and rapidly expanding socioeconomic group and puts forth some provocative ideas for intellectual and policy debates. It will be of importance to students and researchers of sociology, economics, development studies, political studies, Latin American studies, and Asian Studies.
The Middle Classes and the City
by Gary Bridge Michaela Benson Marie-H�l�ne Bacqu� Tim Butler Eric Charmes Yankel Fijalkow Emma Jackson Lydie Launay St�phanie VermeerschWhat does it mean to be middle class in contemporary global cities? What do the middle classes do to these cities and what do these cities do to the middle classes? Do the middle classes engage in social mix or are they focused on 'people like us'? Based on comparative study this book explores middle-class identities across Paris and London.
The Middle East: A Guide to Politics, Economics, Society and Culture (Critical Concepts In Political Science Ser.)
by Barry RubinThe Middle East is an area of great importance globally, yet misperceptions abound. Events have made it a region of special interest to the West and so the search for understanding gains momentum. This publication is intended to clarify the region’s complex history and issues. In developing this project, the contributors’ set out to explore seven significant themes that are usually not found in other sources. While many books focus on political history and conflicts, this two-volume work deals specifically with culture, religion, women, economics, governance, and media, as well as the role that the region’s modern history has played in shaping its society and worldview.
The Middle Income Group in China and Russia (Research Series on the Chinese Dream and China’s Development Path)
by Peilin Li M. K. GorshkovThis book includes a series of papers that mainly discuss the proposition of “double middle-income traps.” It analyzes various perspectives of middle-income groups of Russia and China including employment, education, consumption, mobility, social insurance, social values and identity, social and political participation. This book further indicates that the expansion of middle-income groups plays an important role in promoting mass consumption, maintaining continuous and stable economic growth, and overcoming the double middle-income traps. The middle class and middle-income group generally owns higher economic capital and cultural capital and is proved to be the main strength in expanding consumption by many empirical studies. However, the middle class and middle-income group has currently encountered hindrance to upward mobility, life quality, social security and class identity, which prevent the expansion of the middle-income group and improvement of social structure. Through comparing the middle-income groups of these two countries, this book gives us a panoramic view of their social and economic condition. Successfully combining theory and concrete practical guidelines, the book offers a valuable resource for all those active in this dynamic field. The book is important for students, scholars, researchers and professionals in economic and social science fields.
The Middle of Everywhere: Helping Refugees Enter the American Community
by Mary PipherThe bestselling author of Reviving Ophelia and Another Country profiles refugees from around the world who emigrate to the United States.In cities and towns all over the country, refugees arrive daily. Lost Boys from Sudan, survivors from Kosovo, families fleeing Afghanistan and Vietnam: they come with nothing but the desire to experience the American dream. Their endurance in the face of tragedy and their ability to hold on to the essential virtues of family, love, and joy are a tonic for Americans who are now facing crises at home. Their stories will make you laugh and weep—and give you a deeper understanding of the wider world in which we live.The Middle of Everywhere moves beyond the headlines, into the hearts and homes of refugees from around the world. Her stories bring to us the complexity of cultures we must come to understand in these times. &“Pipher enters the hearts and homes of refugees who now live virtually from coast to coast, chronicling their struggles…. Her work is a plea for others to join her in a campaign of understanding.&”—USA Today&“Pipher unites refugees, people who have fled some of the most oppressive regimes in the world, with all of us…. [She] is taking this moment to teach us un-American behaviors: Patience, manners, and tolerance.&”—Milwaukee Journal Sentinel&“Drawing upon anthropology, sociology and psychology, [Pipher] offers a deft, moving portrait of the complexity of American life…Pipher's ambitious undertaking of combining personal stories with global politics is wonderfully realized.&”—Publishers Weekly (starred review)
The Middle of Somewhere: Rural Education Partnerships and Innovation
by Sara L. Hartman and Bob KleinHighlights innovative partnership practices that help create educational opportunities for students in rural schools across the United States.As editors Sara L. Hartman and Bob Klein acknowledge, rural places have long experienced systemic inequities that decrease rural students' access to education, yet many rural schools and communities have found creative means to make up for the dearth of outside resources. The Middle of Somewhere brings to light a wide variety of partnerships that have been forged between K–12 schools, communities, and postsecondary institutions to improve educational access. The book showcases collaborations that address three different areas of need: partnerships that prepare and support teacher candidates and educators who work in rural areas; partnerships that extend the work of rural education networks; and partnerships that promote equity, justice, and inclusion within rural populations. Using case studies of rural educational partnerships from communities across the United States, the book's contributors share their experiences of how strong partnerships have formed both organically and through thoughtful and intentional planning, and they recommend supportive strategies for their development and sustainment. The contributors also explore the many ways in which university–school–community partnerships incubate solutions to challenges common to rural education systems, such as access to STEM education and higher education. The programs featured here may serve as replicable models for practitioners, researchers, and policy makers who want to enrich the experiences of children in their schools and communities.
The Middling Sort: Commerce, Gender, and the Family in England, 1680-1780
by Margaret R. HuntTo be one of "the middling sort" in urban England in the late seventeenth or eighteenth century was to live a life tied, one way or another, to the world of commerce. In a lively study that combines narrative and alternately poignant and hilarious anecdotes with convincing analysis, Margaret R. Hunt offers a view of middling society during the hundred years that separated the Glorious Revolution from the factory age. Thanks to her exploration of many family papers and court records, Hunt is able to examine what people thought, felt, and valued. She finds that early capitalism and early modern family life were far more insecure than their "classical" models supposed.Commercial needs and social needs coincided to a large extent. The family is central to Hunt's story, and she shows how financial struggles brought conflict, ambiguity, and tension to the home. She investigates the way gender intertwined with class and family hierarchy and the way many businesses survived as precarious successes, secured through the sacrifices made by female as well as male family members.The Middling Sort offers a dynamic portrait of a society struggling to minimize the considerable social and psychic dislocation that accompanied England's launch of a full-scale market economy.
The Migrant Presence: Australian Responses 1947-1977
by Jean I. MartinThis classic work in Australian sociology examines the way in which Australian institutions have responded to the influx of migrants of non-Anglo-Saxon origin. Until the end of the sixties, the typical Australian reaction was that these migrants could be, and were being, assimilated into the mainstream of British-Australian society and culture. At the end of the sixties, both the assimilationist philosophy and the claim of successful and effortless absorption came into question, and migrants of non-English speaking background began to be defined as problems. Now, in a third phase, migrants themselves are rejecting the notion that they are, above all, problems or people with problems. Instead they are asserting their rights and dignity as legitimate minorities in an ethnically plural society. The author goes on to trace in detail the response of the institutions of education, health, and the trade unions to 'the migrant presence'.'Well written, well presented, well documented and challenging.' - C. A. Price, The National Times'Well written, sympathetic to the point of anger and should be included in any course on Australian society or public policy. an invaluable contribution.' - James Jupp, Politics
The Migration Industry in Asia: Brokerage, Gender and Precarity
by Michiel BaasThis pivot considers the emergence and functioning of the migration industry and commercialization of migration pathways in Asia. Grounded in extensive fieldwork and building on empirical data gathered through interactions and interviews with brokers, agents and other facilitators of migration, it examines the increasing co-dependence on, entanglement of and overlap between migrants, industry and state. It considers how for low-skilled migrants, migration is often not even possible without the involvement of the industry. As the opportunity to migrate has opened up to an ever-widening group of potential migrants, receiving nations have fine-tuned their migration infrastructure and programs to facilitate the inflow (and timely outflow) of the migrants it deems desirable. The migration industry plays an active role as mediator between migrants’ desires and states' requirements. This pivot focuses on what unites sending and receiving sides of migration, going beyond presupposed established networks, and offering a clear conceptualization of the contemporary migration industry in Asia.
