- Table View
- List View
The Migration Myth in Policy and Practice: Dreams, Development and Despair
by AKM Ahsan Ullah Md Shahidul HaqueThis book investigates the long-term impact of migration on development, engaging in a thorough analysis of the pertinent factors in migration. Migration scholars and stakeholders have long placed emphasis on the necessity of migration for development. At the heart of this book is the question: Has migration made development necessary, or is it the other way around? While existing literature is predominantly occupied with positive impressions about the migration-development nexus, this book challenges associated pervasive generalizations about the impact of migration, indicating that migration has not impacted all regions equally. This volume thus grapples with the different extents to which migration has impacted development by delving into the social costs that migrants often pay in the long run. With empirical support, this book proffers that some countries are becoming over-dependent on migration. A excellent resource for both policymakers working on migration policy, and scholars in international relations, migration and development studies, this book presents a range of innovative ideas in relation to the remittance-development nexus.
The Migration Turn and Eastern Europe: A Global Historical Sociological Analysis (Marx, Engels, and Marxisms)
by Attila MeleghUsing Marxist and Polanyian frameworks, this book examines the structural and discursive transformation that can explain the polarization of migration debates and within the rise of nationalist anti-migrant discourses in Europe with a special attention to Eastern Europe and Hungary. It goes beyond the mainstream explanations of these phenomena that uses nationalist propaganda as causal factors and instead argues that the rise of anti-immigration currents cannot be understood without a dialectical and historical analysis of the material and discursive transformations, most importantly marketization and related reification. Drawing from thinkers such as Lukács, Polanyi, and Gramsci as well as diverse empirical sources including demographic studies, historical modelling, and discourse analyses, Migration Turn and Eastern Europe is a unique and rigorous study of one of the most pressing and puzzling political and sociological questions of our time.
The Migration of Albanians from Montenegro and Kosovo to the United States: In Search of Home (ISSN)
by Klement R. CamajThis book examines the ways in which Albanian men, women, and families who have migrated from Montenegro and Kosovo to the United States understand and make sense of their mobility and settlement.Drawing on empirical research, including interview material, it goes beyond the experiences of individual migrants to explore the role that cultural identity has in shaping their mobility and immobility, with particular attention to the manner in which subjects talk about their experiences in terms of past and present movements and moments.An original storytelling study of the meaning, scope, and outcomes of mobility, and the construction of home and identity on the part of migrants, this title will appeal to scholars of sociology, geography, anthropology, and politics with interests in migration and diaspora.
The Military-State-Society Symbiosis (Military and Society #5)
by Peter KarstenFirst Published in 1999. Routledge is an imprint of Taylor & Francis, an informa company.
The Millennial Marriage
by Brian J WilloughbyThis essential text explores the concept of "Me-Marriage"—a marital relationship that blends individualized life goals and interests—and draws from research on the current benefits and costs of marriage to consider how to achieve success, both individually and relationally. Chapters explore the larger patterns at play and identify the trends about what a modern "healthy marriage" looks like for this new generation. Brian J. Willoughby combines a review of the latest social science research on the benefits and costs of marriage with new quantitative and qualitative data from married and single adults. The book explores how marriage has fundamentally shifted in the Western world due to the changing values and approaches to relationships by the Millennial generation that is now largely transitioning to marriage. This book is an ideal text for clinicians and practitioners (particularly those working with young married populations) looking for guidance on how to understand the increasingly complex ways that adults are navigating their relationship landscape, as well as students and scholars in the fields of psychology, family studies, and sociology and those interested in individual development, relational development, and demographic trends on the family.
The Millennial Myth: Transforming Misunderstanding into Workplace Breakthroughs
by Crystal KadakiaReady for the Future or Stuck in the Past?Millennials have been condemned as lazy, entitled, disloyal, and disrespectful and needing constant hand-holding. But Crystal Kadakia—a Millennial herself as well as an organizational development consultant and two-time TEDx speaker—shows that not only are these negative stereotypes dead wrong, but each one conceals a positive workplace practice that forward-looking companies must adopt if they are to endure. She illuminates how the advent of digital technology is the crucial root cause of many Millennial behaviors and offers a guide for what our traditional workplace needs to do to attract, engage, and retain modern talent.
The Millionaire Mind
by Thomas J. StanleyThe Millionaire Mind targets a population of millionaires who have accumulated substantial wealth and live in ways that openly demonstrate their affluence. Exploring the ideas, beliefs, and behaviors that enabled these millionaires to build and maintain their fortunes, Dr. Stanley provides a fascinating look at who America's financial elite are and how they got there. What were their school days like? How did they respond to negative criticism? What are the characteristics of the millionaire's spouse? Is religion an important part of their lives? The author uncovers the surprising answers to these and similar questions, showing readers through concrete examples just what it is that makes the wealthy prosper when others would turn away dejected or beaten. The Millionaire Mind promises to be as transformational as Dr. Stanley's previous best-seller. This book answers universal questions with solid statistical evidence in an approachable, and anecdotal style.
The Millionaire Next Door: The Surprising Secrets Of America's Wealthy (Millionaire Set #2)
by William D. Danko Dr. Thomas J. StanleyHow do the rich get rich? An updated edition of the &“remarkable&” New York Times bestseller, based on two decades of research (The Washington Post). Most of the truly wealthy in the United States don&’t live in Beverly Hills or on Park Avenue. They live next door. America&’s wealthy seldom get that way through an inheritance or an advanced degree. They bargain-shop for used cars, raise children who don&’t realize how rich their families are, and reject a lifestyle of flashy exhibitionism and competitive spending. In fact, the glamorous people many of us think of as &“rich&” are actually a tiny minority of America&’s truly wealthy citizens—and behave quite differently than the majority. At the time of its first publication, The Millionaire Next Door was a groundbreaking examination of America&’s rich—exposing for the first time the seven common qualities that appear over and over among this exclusive demographic. This edition includes a new foreword by Dr. Thomas J. Stanley—updating the original content in the context of the financial crash and the twenty-first century. &“Their surprising results reveal fundamental qualities of this group that are diametrically opposed to today&’s earn-and-consume culture.&” —Library Journal
The Milltown Boys at Sixty: The Origins and Destinations of Young Men from a Poor Neighbourhood
by Howard WilliamsonThe Milltown Boys at Sixty is a story like no other, giving both an insider and an outsider view of the ‘Milltown Boys’, exploring the nature of an ethnographic relationship based on research about their experiences of the criminal justice system. A group classically labelled as delinquents, drug-takers and drop-outs, the Boys were also, in many different ways, fathers, friends and family men, differentially immersed in the labour market, in very different family relationships and now very differently connected to criminal activity. Williamson has written books capturing their experiences over the fifty years of his continued association with them: about their teenage years; and twenty years later, in middle-age. This book is about them as they pass the age of 60, providing a personal account of the relationship between Williamson and the Boys, and the distinctive – perhaps even controversial – research methodology that enabled the mapping of their lives. It provides a unique and detailed insight into the ways in which the lives of the Milltown Boys that started with such shared beginnings have unfolded in so many diverse and fascinating ways. These accounts will be of interest to the lay reader curious about the way others have managed (or failed to manage) their lives, the professional who works with those living, often struggling, on the wrong side of the tracks, and the academic researching and teaching about social exclusion, substance misuse, criminal justice transitions and the life course.
The Mimetic Nature of Dream Mentation: American Selves in Re-formation (Culture, Mind, and Society)
by Jeannette Marie MageoBased on over a decade of research, this book connects dream studies to cognitive anthropology, to perspectives in the humanities on mimesis, ambiguity, and metaphor, to current dream research in psychology, and to recent work in economic and political relations. Traveling the dreamscapes of a variety of young people, Mimesis and the Dream explores their encounters with American cultures and the identities that derive from these encounters. While ethnographies typically concern shared social habits and practices, this book concerns shared aspects of subjectivity and how people represent and think about them in dreams. Each chapter grounds theory in actual cases. It will be compelling to scholars in multiple disciplines and illustrates how dreaming offers insights into twenty-first century debates and problems within these disciplines, bringing a vital theoretically eclectic approach to dream studies.
The Mind and Faith of Justice Holmes: His Speeches, Essays, Letters, and Judicial Opinions
by Max LernerA reprint of the Little, Brown edition of 1943. Acidic paper. Annotation copyright Book News, Inc. Portland, Or.
The Mind and Teachers in the Classroom: Exploring Definitions of Mindfulness
by Remy Y. LowThis book explores what mindfulness could mean for teachers and educational researchers. Moving beyond popular platitudes about mindfulness, the author provides a conceptual map for understanding the different ways in which mindfulness can be recommended to teachers. Covering the key features of Buddhist, psychological and socially engaged forms of mindfulness, this book critically examines the different ways mindfulness is defined, what problems it is meant to address, and the ways that claims about mindfulness are made. It argues that each approach to mindfulness implies an ideal of what a ‘good teacher’ should be. It will be of interest and value to teacher educators, educational researchers and scholars of mindfulness within education.
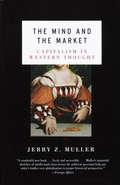
The Mind and the Market
by Jerry Z. MullerCapitalism has never been a subject for economists alone. Philosophers, politicians, poets and social scientists have debated the cultural, moral, and political effects of capitalism for centuries, and their claims have been many and diverse. The Mind and the Market is a remarkable history of how the idea of capitalism has developed in Western thought.Ranging across an ideological spectrum that includes Hobbes, Voltaire, Adam Smith, Edmund Burke, Hegel, Marx, and Matthew Arnold, as well as twentieth-century communist, fascist, and neoliberal intellectuals, historian Jerry Muller examines a fascinating thread of ideas about the ramifications of capitalism and its future implications. This is an engaging and accessible history of ideas that reverberate throughout everyday life.From the Trade Paperback edition.
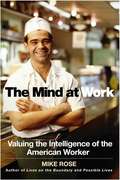
The Mind at Work: Valuing the Intelligence of the American Worker
by Mike RoseIn the tradition of Barbara Ehrenreich's "Nickel and Dimed" and Studs Terkel's "Working", "The Mind at Work" is an illuminating reassessment of American labor. Testimonials to physical work have always celebrated the dignity, the economic and moral value, even the nobility of blue-collar labor, but rarely the thought required to get the job done right. The lightning-fast organization and mental calculations of the waitress; the complex spatial mathematics of the carpenter; the aesthetic and intellectual dexterity of the hair stylist, our failure to acknowledge or respect these qualities has undermined a large portion of America's working population. Integrating personal stories of his own working-class family with interviews, vivid snapshots of people on the job, and current research in social science and cognitive psychology, Rose draws a brilliantly original portrait of America at work. As he probes the countless decisions, computations, and subtle judgments made every day by welders and plumbers, waitresses and electricians, Rose redefines the nature of important work and overturns the "hand/brain" dichotomy that blinds us to the real contributions of working people.
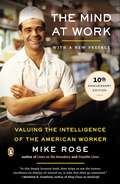
The Mind at Work: Valuing the Intelligence of the American Worker
by Mike RoseRead Mike Rose's posts on the Penguin Blog. As did the national bestseller Nickel and Dimed, Mike Rose’s revelatory book demolishes the long-held notion that people who work with their hands make up a less intelligent class. He shows us waitresses making lightning-fast calculations, carpenters handling complex spatial mathematics, and hairdressers, plumbers, and electricians with their aesthetic and diagnostic acumen. Rose, an educator who is himself the son of a waitress, explores the intellectual repertory of everyday workers and the terrible social cost of undervaluing the work they do. Deftly combining research, interviews, and personal history, this is one of those rare books that has the capacity both to shape public policy and to illuminate general readers. .
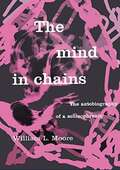
The Mind in Chains: The Autobiography of a Schizophrenic
by William Lewis MooreIn this classic account of schizophrenia, Moore describes his struggle with madness. "How does it feel to be treated as mad? How do things look to you? And, above all, how do you preserve hope and dignity and keep your identity in a hospital for the insane? This unique and powerful book is authored by an ex-Marine and graduate student who suddenly finds himself stigmatized as a schizophrenic and committed to an insane asylum. It lays bare the secrets and hiding places of the soul with a frankness that will astonish the reader." From Dust Jacket. The "Mind in Chains" combines the interest of a study of schizophrenia with the fascination of a detective story.
The Mind in Exile: Thomas Mann in Princeton
by Stanley CorngoldA unique look at Thomas Mann’s intellectual and political transformation during the crucial years of his exile in the United StatesIn September 1938, Thomas Mann, the Nobel Prize–winning author of Death in Venice and The Magic Mountain, fled Nazi Germany for the United States. Heralded as “the greatest living man of letters,” Mann settled in Princeton, New Jersey, where, for nearly three years, he was stunningly productive as a novelist, university lecturer, and public intellectual. In The Mind in Exile, Stanley Corngold portrays in vivid detail this crucial station in Mann’s journey from arch-European conservative to liberal conservative to ardent social democrat.On the knife-edge of an exile that would last fully fourteen years, Mann declared, “Where I am, there is Germany. I carry my German culture in me.” At Princeton, Mann nourished an authentic German culture that he furiously observed was “going to the dogs” under Hitler. Here, he wrote great chunks of his brilliant novel Lotte in Weimar (The Beloved Returns); the witty novella The Transposed Heads; and the first chapters of Joseph the Provider, which contain intimations of his beloved President Roosevelt’s economic policies. Each of Mann’s university lectures—on Goethe, Freud, Wagner—attracted nearly 1,000 auditors, among them the baseball catcher, linguist, and O.S.S. spy Moe Berg. Meanwhile, Mann had the determination to travel throughout the United States, where he delivered countless speeches in defense of democratic values.In Princeton, Mann exercised his “stupendous capacity for work” in a circle of friends, all highly accomplished exiles, including Hermann Broch, Albert Einstein, and Erich Kahler. The Mind in Exile portrays this luminous constellation of intellectuals at an extraordinary time and place.
The Mind of Everyday: Combining Individual and Artificial Intelligence
by Petraq Papajorgji Howard MoskowitzThe advent of artificial intelligence (AI) is associated with relevant changes in how we live today. AI has the potential to significantly enhance daily decision-making by providing tailored, data-dependent insights and aiding in intricate analysis. AI-based systems will be around us, helping and advising us in our everyday tasks. However, how well do these systems perform in their quest to "replace" the human brain? A "meter," a procedure for comparing the outcomes obtained by artificial intelligence systems with those obtained by human systems, is necessary to address this issue. This "meter" is Mind Genomics, a new emerging science that delves into the science of how we, as humans, organize and respond to information. To evaluate whether there are differences in the results obtained by AI-based systems and human-based experiments based on 'Outer Psychophysics' were designed and implemented. Thus, four experiments in crucial areas of our lives are selected and cover education, family stress, and environmental and governmental policies. For each area, a Mind Genomic experiment is designed, defining four topics (silos). Then, the elements contained in each of the silos were generated twice, once by humans and then by an AI-based system. Evaluating both systems' performance requires comparing the results obtained by both experiments. The analysis of the study cases is disciplined, rich in scientific tools, and presented with methods. Through a blend of theoretical exploration, case studies, and practical applications, this book aims to inspire readers with the potential of the fusion of Mind Genomics and AI to empower innovation, enhance user experiences, and bring forth a more nuanced understanding of human thought. Whether the reader is a student, a researcher in the field of social and political sciences, or simply curious about the evolving landscape of science and technology, we hope this book will serve as an invitation to explore how we can harmonize human and machine intelligence to better navigate the complex world around us.
The Mind of a Leader: A Christian Perspective of the Thoughts, Mental Models, and Perceptions That Shape Leadership Behavior (Christian Faith Perspectives in Leadership and Business)
by Bruce E. WinstonThis edited collection examines the mind of leaders throughout the Bible to understand how thoughts and behaviors can support or sabotage leadership efforts. It is divided into three parts: the first part addresses thinking, influence, and communicating through the theoretical lenses of humility, metacognition, and personal well-being. Part Two addresses managing, motivating, and change through the theoretical lenses of leader-follower relationships and Lewin’s change model. Finally, Part Three addresses ethics, service, and character through the theoretical lenses of participative leadership, inclusivity, resilience, and mentoring. Each chapter uses a biblical example to demonstrate the role of the mind in the effectiveness of different leaders. This volume will serve as a valuable resource to researchers interested in leadership studies, particularly those examining the biblical perspective.
The Mind of a Primitive Man: Hereditary Characteristics, Linguistic and Cultural Traits of the Human Races
by Franz Boas“In this landmark text of anthropology, Franz Boas profiles various groups of primitive peoples, analyzing their hereditary characteristics, morphology, language and cultures.Brimming with incisive analysis and fascinating interpretations of early man, Boas begins by acknowledging the sheer diversity of peoples in the world. The variation in language, physical appearance, cultural mores and traditions are extraordinary, with differing behavioral standards and practices unique to each. Though dealing with a formidable subject of global scope, the author proceeds with determination and intellectual rigor, demonstrating how geographic disparity, variations in climate, and divergent psychology resulted in distinct cultures.Famous for challenging existing views, including those of eugenics and white supremacy, The Mind of Primitive Man became a foundational text of modern anthropologic science. Its well-argued topics, rooted in the author's voracious study and experience, contradicted existing theories and assumptions of nature versus nurture, and the relationship between environment and human intelligence. For his part, Boas held out hope that anthropology would form a role in education, increasing tolerance for the differences between cultures, and acknowledgement of the value all have contributed.”-Print ed.
The Mind of the South
by W. J. CashEver since its publication in 1941, The Mind of the South has been recognized as a path-breaking work of scholarship and as a literary achievement of enormous eloquence and insight in its own right. From its investigation of the Southern class system to its pioneering assessments of the region's legacies of racism, religiosity, and romanticism, W. J. Cash's book defined the way in which millions of readers -- on both sides of the Mason-Dixon line -- would see the South for decades to come. This new, fiftieth-anniversary edition of The Mind of the South includes an incisive analysis of Cash himself and of his crucial place in the history of modern Southern letters.
The Mindful Golfer: How to Lower Your Handicap While Raising Your Consciousness
by Stephen AltschulerGolf is a Zen sport. If you leave the present moment, you will likely feel the immediate karmic consequences like a hammer hitting your thumb. In The Mindful Golfer: How to Lower Your Handicap While Raising Your Consciousness, Stephen Altschuler helps you nail it all right--hard and true and into another level of surrender, satisfaction, and, self-awareness. He uses the tools of Zen to raise the game several notches on the ladder of consciousness. The book discusses the state of the game, some of its more illustrious players, its glories, and its challenges. The author covers some of his own struggles with golf, and some moments of achievement, if only fleeting. His book is a reflective look at golf today, emphasizing the mental and spiritual elements of the game.
The Mindful Leader: Awakening Your Natural Management Skills Through Mindfulness Meditation
by Michael CarrollA new generation of business leaders is turning to mindfulness as a cutting-edge leadership tool. Scientific research suggests that the practice of mindfulness (a technique for learning to live in the present moment) can help individuals to gain clarity, reduce stress, optimize performance, and develop a greater sense of well-being.In The Mindful Leader, Michael Carroll explains what mindfulness is and how to develop it in the hectic and often stressful environment of the twenty-first century workplace. He focuses on ten key principles of mindfulness and how they apply to leading groups and organizations. Along the way, Carroll addresses a range of topics, including how to:heal the "toxic workplace," where anxiety and stress impede performancecultivate courage and confidence in the face of workplace difficultiespursue organizational goals without neglecting what's happening here and nowlead with wisdom and gentleness, not just with ambition and powerstart a personal meditation practice to develop your innate leadership talentsFull of engaging stories and practical exercises, The Mindful Leader will help leaders in any field to discover their innate intelligence, bravery, and joy on the job.
The Mindful Teen: Powerful Skills to Help You Handle Stress One Moment at a Time (Instant Help Solutions Ser.)
by Dzung X. VoIn this powerful book, a pediatrician specializing in teen and adolescent medicine offers a breakthrough mindfulness program to help you deal with stress in healthy ways, improve communication, and reduce conflicts with family and friends. <P><P>Being a teen is stressful! Whether it’s school, friends, or dating, the teen years are full of difficult changes―both mentally and physically. If you're like many teens, you may have difficulty dealing with stress in effective ways. You aren’t alone, and there are things you can do to stay calm, no matter how stressful life becomes. All you need to do is stop, breathe, and be mindful and aware in the present moment. <P><P>The Mindful Teen offers a unique program based in mindfulness-based stress reduction (MBSR) and mindfulness-based cognitive therapy (MBCT) to help you deal with stress. The simple, practical, and easy-to-remember tips in this book can be used every day to help you handle any difficult situation more effectively―whether it’s taking a test at school, having a disagreement with your parents, or a problem you are having with friends. <P><P>If you’re ready to uncover your own inner strength and resilience through mindful awareness and take charge of your life, this book will show you how.
The Mindful Workplace
by Michael ChaskalsonThis book offers a practical and theoretical guide to the benefits of Mindfulness-Based Stress Reduction (MBSR) in the workplace, describing the latest neuroscience research into the effects of mindfulness training and detailing an eight-week mindfulness training course.Provides techniques which allow people in organizations to listen more attentively, communicate more clearly, manage stress and foster strong relationshipsIncludes a complete eight-week mindfulness training course, specifically customized for workplace settings, along with further reading and training resourcesWritten by a mindfulness expert and leading corporate trainer